Brands are absorbing the cost of digital commerce in abandoned carts, high return rates, eroding margins, and non-stop spending to reacquire the same customers.
You are probably looking at your Shopify profit report right now and feeling reasonably okay about it.
Here is the thing. That report was never built to answer the question you are asking it. It does not see your ad spend, your 3PL invoice, or your app stack. Profit gets reported only for products that had a cost recorded at the moment they sold.
Not slightly optimistic, then. Structurally incomplete.
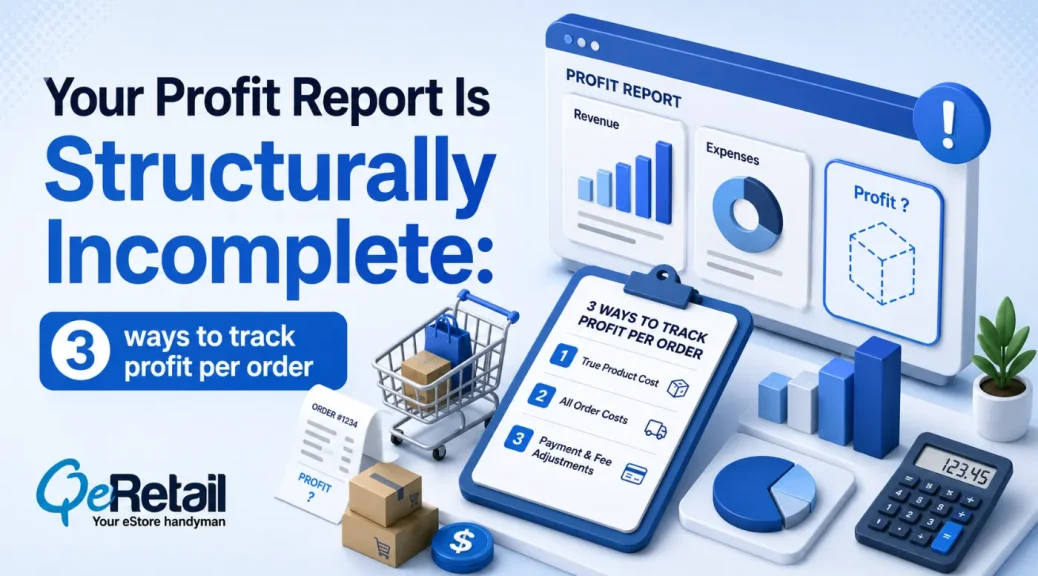
This piece focuses on why the number breaks, and the three ways owners actually track profit per order.
Key Action Points:
- Audit which SKUs have a cost per item recorded, then backfill the blanks
- Separate gross profit from contribution after ad spend and fees
- Rebuild cost inputs quarterly, because landed cost moves and your report does not
- Match your tracking method to order volume, not ambition
- Judge campaigns on contribution, not on the dashboard’s profit column

Why do Most Shopify Stores Read the Wrong Profit Number?
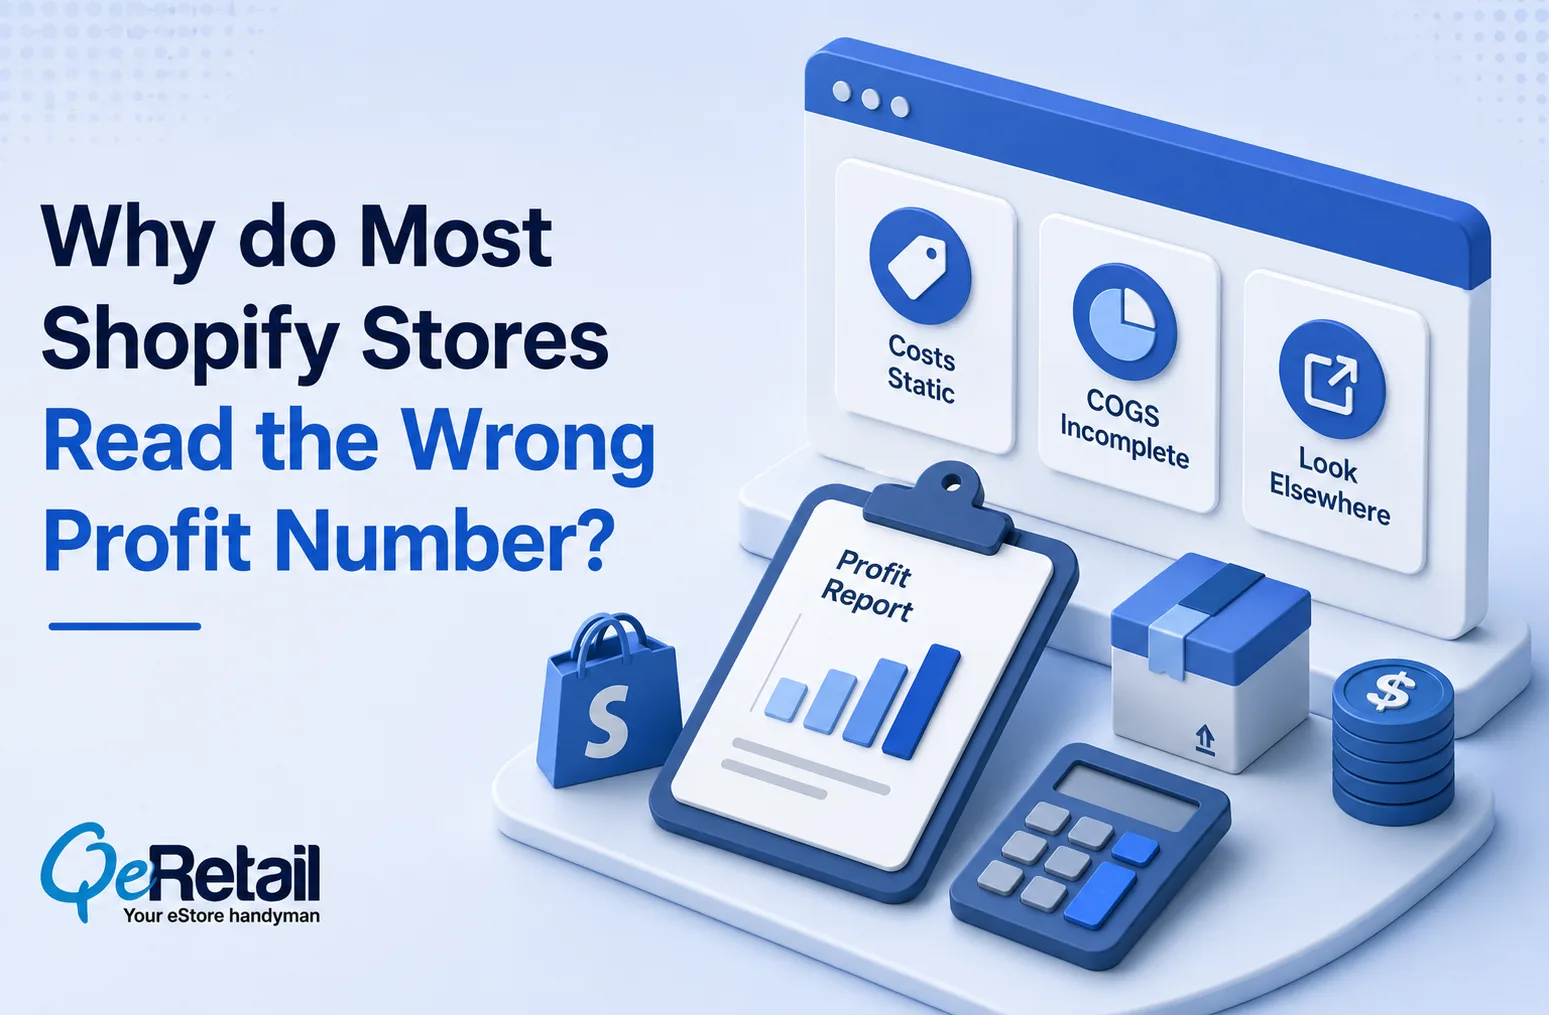
The dashboard is not lying. It is answering a narrower question than the one you typed into it. Three gaps do most of the damage.
Gap 1: Cost data is static. Your costs are not.
Profit is reported only for products and variants that had cost recorded at the time they were sold, and the Cost per item field “contains static data, which means that the data in your profit reports is only relevant to a specific point in time.”
Every order before that date reports as near pure profit. Landed cost jumped in March, and nobody updated the field?
You have been overstating margin ever since, quietly, in a way that looks completely normal.
Expert Take:
You cannot app your way out of this. Shopify stores cost as a snapshot, so every tool reading that field inherits the same staleness. The fix is operational, not technical. Someone owns cost updates on a calendar, or the data decays all year while nobody notices.
Quick Wins:
- Export your product list and find every variant with a blank cost per item
- Put a quarterly landed-cost refresh on someone’s actual calendar
- Note the date of your last cost update inside your reporting sheet
Gap 2: COGS was never meant to measure profitability.
Shopify’s own 2025 guidance on cost of goods sold names the limitation directly. COGS is “incomplete,” covering direct costs while excluding marketing, administrative expenses, and overhead. It is also “not real-time,” which means it “may not capture real-time fluctuations in production costs, potentially leading to outdated or misleading financial insights.”
Expert Take:
Shopify draws the distinction itself. COGS covers materials and direct labor, while cost of revenue adds order fulfillment, shipping to customers, payment processing fees, and platform fees. Your profit report runs on the first. Your bank account runs on the second.
Quick Wins:
- Add fulfillment, shipping, and processing fees to your per-order math
- Treat gross profit as a pricing signal, never a scaling signal
Gap 3: Shopify tells you to look elsewhere.
This is the part most owners miss. In the same help doc, Shopify recommends that merchants needing dynamic cost data should “run your financial reports in another business system, such as an enterprise resource planning (ERP) or Accounting system,” use a reporting app, or calculate costs and profits manually.
The platform is telling you its profit report has a ceiling. Most stores never read that far.
Expert Take:
Read that recommendation for what it is. Shopify is not calling its profit report broken; it is scoping it. The report is a store analytics feature, not an accounting ledger, and it was never built to be one. Owners who treat the dashboard as the source of truth are using a directional tool for a financial decision.
Quick Wins:
- Pick one system outside Shopify as your profit source of truth, and name it out loud to your team.
- Reconcile Shopify’s profit report against your accounting P&L once a month and log the variance.
- Before any budget or pricing decision, ask which of the two numbers you are actually looking at

The 3 Ways Store Owners Actually Track Profit Per Order
Nobody arrives at a real-time P&L on day one. Owners move through three tiers, each breaking somewhere predictable. The mistake is rarely picking the wrong method. It is staying on one past the point where it stopped telling the truth.
Method 1: Cost per unit, worked out on the back of an envelope
Figure out what one unit costs to land, add your margin, add tax, price from there. It works better than most owners give it credit for, because it needs no tooling and forces you to know your COGS cold.
One fatal blind spot, and it is acquisition. The method prices the product correctly while saying nothing about the cost of finding a buyer. Fine while you sell through owned channels. The month you switch on paid, it stops describing your business.
Method 2: The interconnected spreadsheet model
The model becomes a workbook rather than a calculation: assumptions, unit economics, P&L, cash flow, three scenarios, each tab feeding the next. Change one assumption and everything downstream updates.
Deloitte found 95% of surveyed retail executives expect global trade policies to push costs higher in 2026. Scenario modeling stops being optional in that environment.
A model is only as current as whoever maintains it. Most stop being accurate around week six.
Method 3: Live integration and a real-time per-order P&L
The third tier wires cost data, ad spend, and store data together so profit calculates per order automatically. Decisions land in hours instead of at month-end.
Here is the caveat the app listings skip. These tools read your cost inputs. They do not verify them. Connect a real-time dashboard to a catalog full of stale or missing cost data and all you have purchased is a faster way to be wrong.
Which Method Fits Your Store?
- At $100K–$200K, the constraint is data hygiene. Backfill cost per item across every variant, build one sheet for your top ten SKUs, and put the software budget into inventory instead.
- At $200K–$400K, paid acquisition is material and the envelope method has quietly stopped working. Move to the connected workbook and pair it with real work on reducing your Shopify customer acquisition cost.
- At $400K–$500K+, decision speed is the constraint. Automate, then audit the automation quarterly.
Final Thoughts
Most stores at this tier are not unprofitable. They are unaware. Fixable.
And the pressure is not easing. McKinsey’s State of the Consumer 2026, surveying 4,863 consumers across five markets, found more than three-quarters still trading down and 82% using items longer before replacing them.
Brands can reduce cost out of products and operations rather than absorb the squeeze into margins. You cannot strip out what you never measured.
Here is the uncomfortable version. Install a profit app, skip the cost backfill, and you did not start tracking profit. You automated a guess.
So start with the backfill, not the app. If you want a second set of eyes on which costs your reports are missing and what your real contribution margin looks like per order, book an eCommerce strategy session and we will walk your numbers with you.
Stop scaling on the dashboard number. Start scaling on the one your bank account agrees with.
Frequently Asked Questions
Does Shopify Show Net Profit?
Why Is My Shopify Profit Margin Higher Than My Bank Balance?
Is A Profit Tracking App Worth It For A $200k Store?
How Long Does This Take To Set Up?
Table of Contents