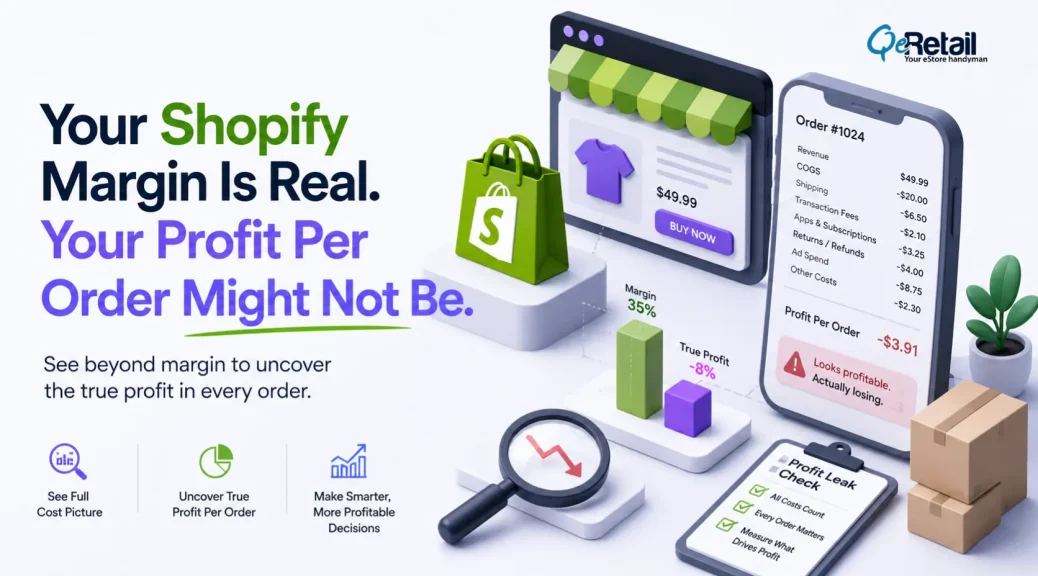
You check your gross margin, see 60-70%, and feel good.
Meanwhile, ad spend, card fees, and shipping are quietly eating half of that before the order even counts as profit. That gap is where a lot of $100K-$500K Shopify stores run into trouble without noticing.
This isn’t a bookkeeping issue. It’s one number founders skip that decides whether a sale was worth making at all.
This piece discusses why a 70% Shopify store is losing money, where margins go, and how to fix it.
Key Takeaways:
- Look at profit per order, not just margin per month
- Know the most you can spend to win a customer before that order loses money
- Cap ad spend at a fixed share of your per-order profit, not “whatever the ad platform says is working”
- Track card fees and shipping separately from product cost
- Redo the math whenever your average order value or shipping cost changes
Quick Wins: Do This This Week
- Pull your last 30 days of orders and calculate real profit per order (revenue minus product cost, fees, shipping, returns) for your top 3 SKUs
- Check your actual card processing rate on your last statement against the standard assumption; most founders are off by half a point.
- Set a hard break-even ceiling per top product and text it to whoever runs your ads today.
- Flag any product where shipping cost exceeds 15% of order value and pause ad spend on it until fixed.
- Build a 5-column spreadsheet (product, cost, fees, shipping, real profit) for your top 10 SKUs; it takes under two hours.

Why a “70% Margin” Shopify Store is Not Enough?
Gross margin only subtracts what the product costs you to make or buy. It ignores everything that happens after checkout: payment fees, shipping, packaging, returns.
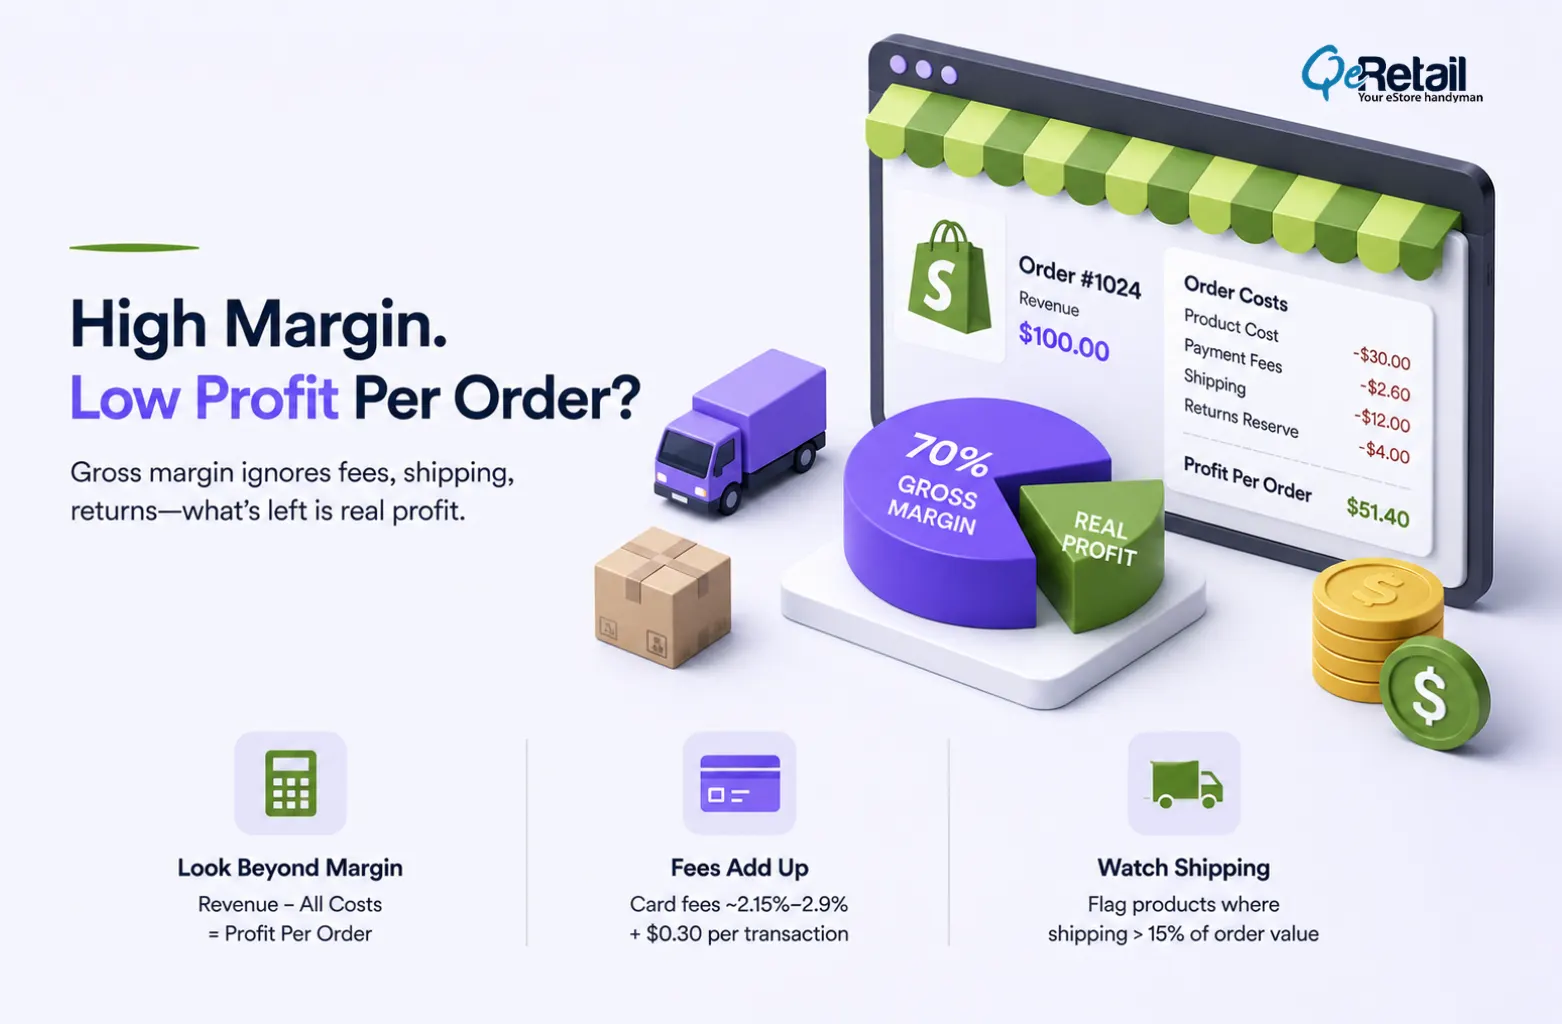
The number that matters: take your revenue, subtract product cost, then subtract payment fees, shipping, and returns. What’s left is what you actually keep per order.
Founders who say “we run 70% margin” are almost always talking about gross margin. Real profit per order usually lands 20-35 points lower. If you’re pricing ad spend off the wrong number, a campaign that looks profitable can quietly be losing money.
Expert Take:
Gross margin is a manufacturing number wearing a profit number’s clothes. It tells you what the product costs, not what the sale costs. Stores that price ad spend off gross margin are budgeting against a number that was never designed to include marketing at all.
Quick Wins:
- Build a profit sheet per product, not one average for the whole store
- Card processing runs roughly 2.15%-2.9% plus 30 cents per transaction; track it separately from product cost
- Flag any product where shipping eats more than 15% of the order value
Where Does the Margin Actually Go?
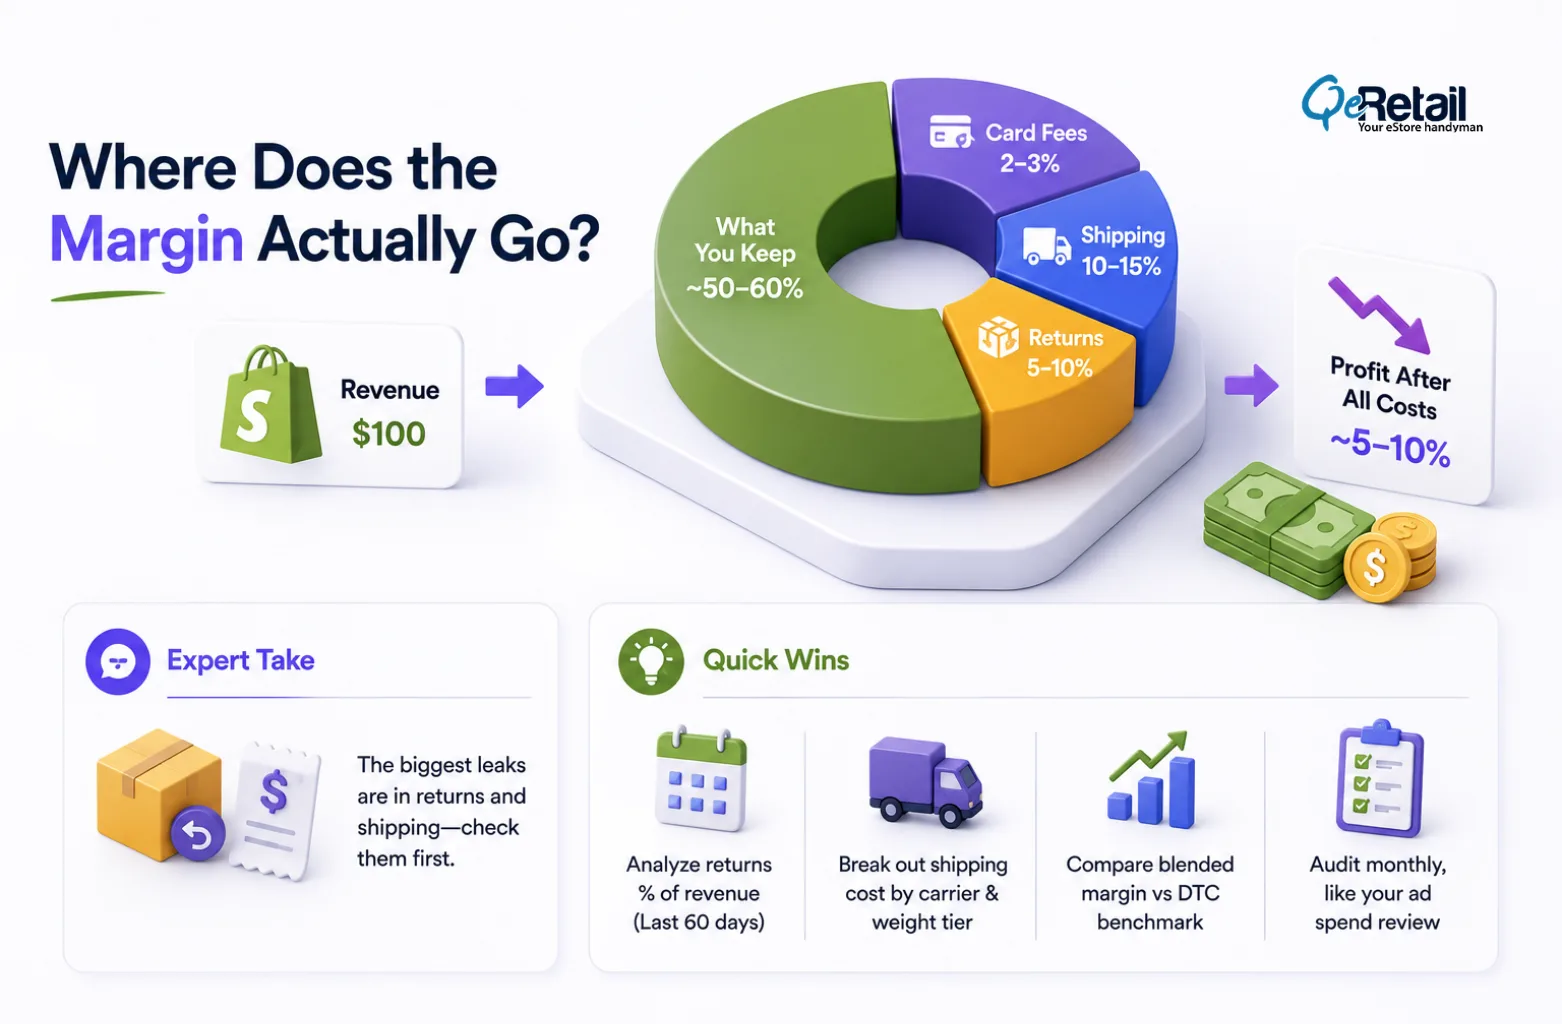
Card fees look small on their own, 2-3% per sale. Shipping and returns add more. Layer them together, and a big piece of your “profit” disappears before you’ve spent a dollar on ads.
McKinsey’s research on direct-to-consumer brands found that D2C sellers can run margins about 4 points higher than selling through Amazon and 2 points higher than blended retail channels, but only when they control these costs directly.
Deloitte’s retail research points in the same direction: online sales typically run a thin -5% to 5% margin, versus 3-7% for in-store sales. Online margin is thinner by default; every fee you don’t track further shrinks it.
Expert Take:
Most founders hunt for margin leaks in ad spend first because that’s the number they check daily. The bigger leak usually sits in returns and shipping, the two line items nobody reviews monthly. Audit those before you touch your ad budget.
Quick Wins:
- Pull your last 60 days of returns and calculate returns as a % of revenue
- Break out shipping cost per order by carrier and weight tier
- Compare your blended margin against the DTC benchmark
- Audit returns and shipping line items monthly, same cadence as your ad spend review; both usually get checked far less often.

The Real Limit on What You Can Pay for a Customer
Your break-even cost per customer isn’t “price minus product cost.” It’s the ad spend above which a sale stops making you money.
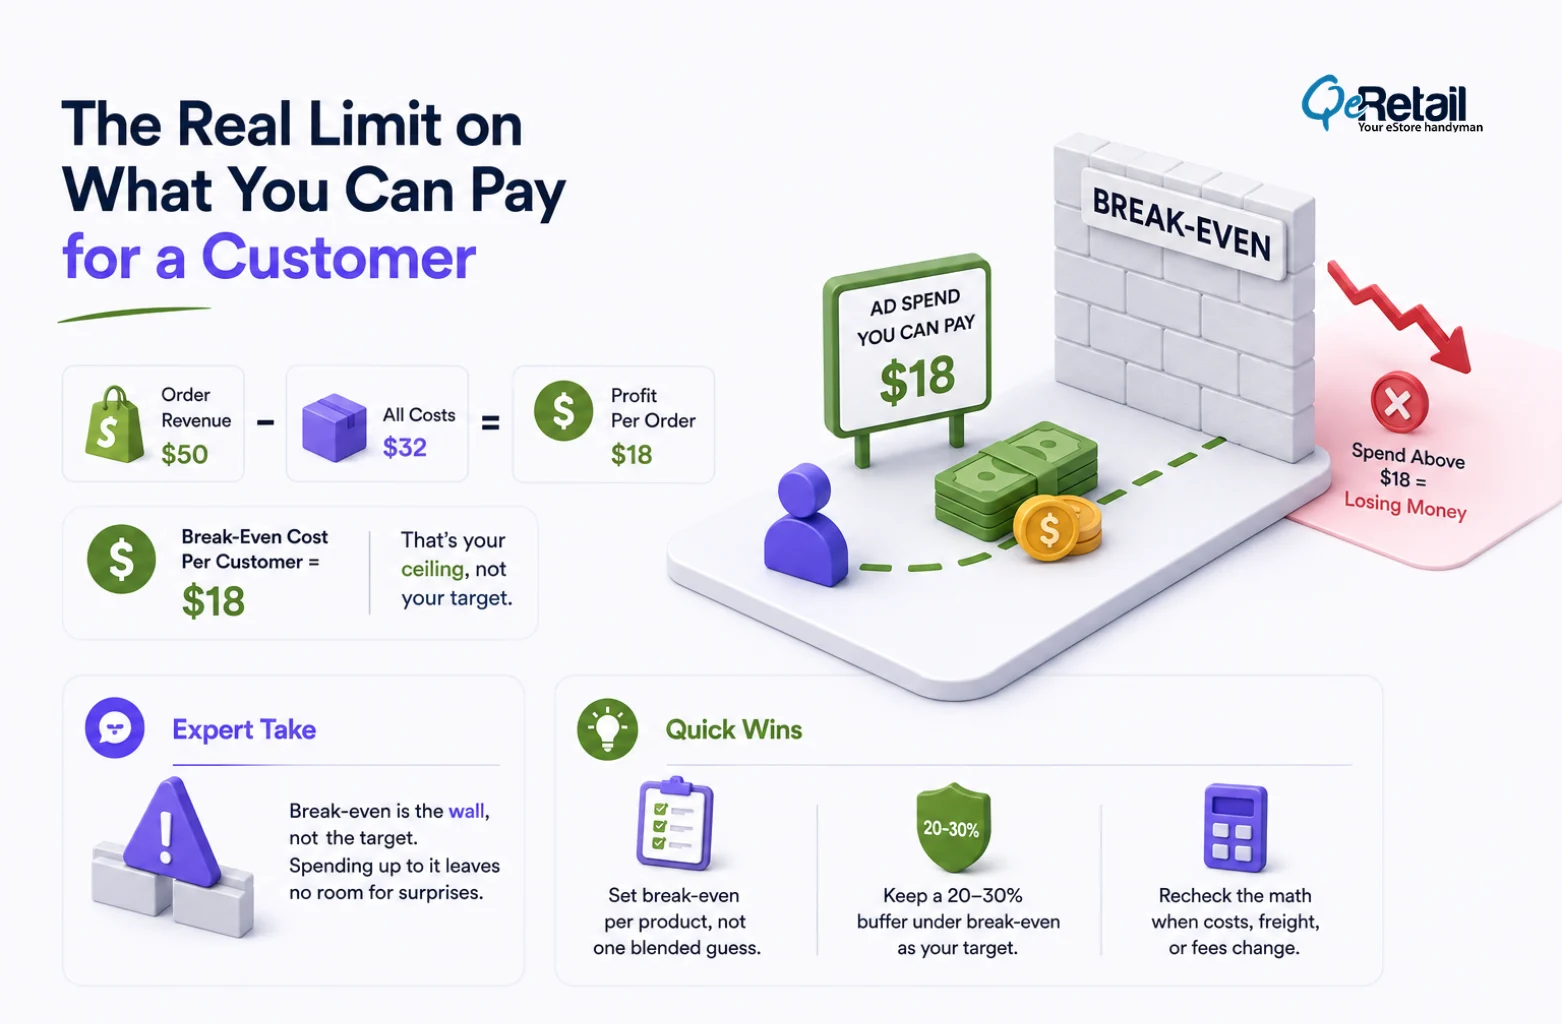
The math: your break-even cost per customer equals your profit per order in dollars. A $50 order with $18 of real profit means $18 is your ceiling, not your target. Break-even means you made nothing on that sale. One refund or one shipping surprise, and it’s a loss.
Customer acquisition costs keep climbing industry-wide. Forbes, reporting on 2026 eCommerce challenges, notes that some brands now lose money on every new customer before that customer buys again, a sharp shift from a decade ago when acquiring a customer barely dented the margin. That trend makes the break-even ceiling more important every year, not less.
Expert Take:
Break-even isn’t a floor; it’s a trap if you spend right up to it. Treat your break-even number as the wall, not the target, or one bad shipping week turns a “profitable” campaign into a loss you won’t see until the monthly close.
Quick Wins:
- Set a break-even number for each core product, not one blended guess
- Build in a 20-30% buffer under break-even as your actual spending target
- Recheck the math whenever product cost, freight, or fees shift
What Does This Look Like at Different Store Sizes?
$100K-$200K stores get clear on each product.
One weak product can drag your whole store’s average down without you noticing.
- Build a profit sheet per product before your next campaign
- Confirm your actual card processing rate against what you assumed
- Set one hard spending ceiling per best-selling product
$200K-$400K stores build a live dashboard.
Watching ad return on spend alone hides fees, returns, and shipping.
- Pull product cost, fees, and shipping into one dashboard you check regularly.
- Track spending by channel; a blended number hides which channel is actually losing money
- Recalculate profit for every bundle or discount code you run
Do this: review margin monthly, tied to your ad budget decisions.
$400K-$500K+ stores protect your margin as you grow.
Wholesale, marketplaces, and your own site carry different margin models; model them separately, and build extra room into your break-even math for any product line with a high return rate.
Do this: model what happens to your numbers if your cost per customer rises 10%, 20%, or 30% before committing to your next round of ad spend.
Efficiency gains compound here too. Accenture’s work with retailers on integrated commerce operations found that tightening these operational pieces can lower operating costs by up to 10% and lift EBITDA margins by up to 10%, proof that the fix is usually operational discipline, not a bigger ad budget.
Expert Take:
Store size doesn’t change the math; it changes what breaks first. Small stores lose margin to one bad product. Bigger stores lose it to channel blending and complexity nobody’s untangled. Same disease, different symptom.
Stop Watching Ad Return. Start Watching Real Profit.
Ad return on spend is easy to check, which is why most founders default to it. But it ignores fees, shipping, returns, and rising product costs, the exact costs that turn a campaign that “looks” profitable into one that isn’t.
Stores that grow steadily spend against a real, current break-even number, not a guess from three months ago. Every growth dollar protects the margin rather than borrowing against it.
If your margin is slipping while your ad numbers look fine, the sales are real, but the profit isn’t. Book your eComm B2B strategy session, and our team of experts will map your real break-even number from your own order data.
Frequently Asked Questions
What's The Difference Between Gross Margin And Real Profit Per Order?
How Do I Find The Most I Can Spend To Get A Customer?
What Ratio Of Customer Value To Acquisition Cost Should A $ 100k–$500k Store Aim For?
Can A Small Team Track This Without Hiring A Finance Person?
Table of Contents