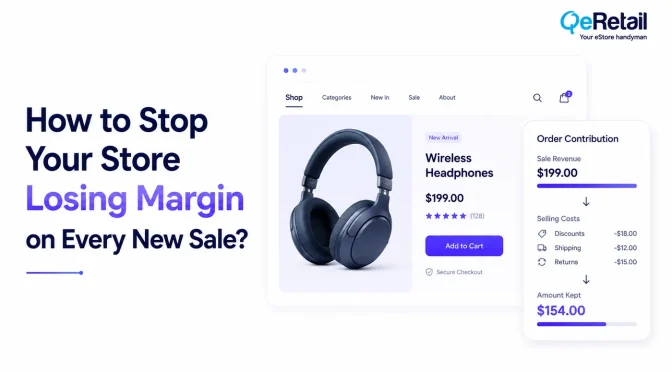
Repeat customers generate 67% more revenue per order after 30 months compared to their first purchase, according to Bain and Company research.
At a $100K to $500K level of revenue, the majority of Shopify stores will take the same approach to customer engagement: whether it’s email, a discount, or even budgeting for retargeting, they are all the same.
The result? A marketing spend that is thin on the ground, with customers that won’t come back again, and a big spend that is quietly going to competitors who make your big spenders feel good.
The gap is not the strategy, but data.
Most store owners aren’t sure who their top 20% customers are in their store at a particular moment.
This guide will provide you with a system that you can follow step-by-step to locate them within Shopify, comprehend what sets them apart, and structure your entire retention campaign around that 20%.
This Guide Covers:
- What the 80/20 rule actually means for Shopify revenue (with real audit data)
- How to pull and read your top customer segments using Shopify’s native tools
- The RFM scoring framework and how to apply it
- What our internal audits of 140+ Shopify stores revealed about segmentation gaps
Key Action Points:
- Export your Shopify customer report sorted by total spend.
- Apply the RFM framework to score your customers.
- Track the purchase frequency of high-single-spend buyers.
- Build a dedicated email segment for customers with 3+ orders.
- Run a 90-day retention audit on your top 20% to measure churn rate before it compounds.
- Create an ad exclusion list from your top customers.
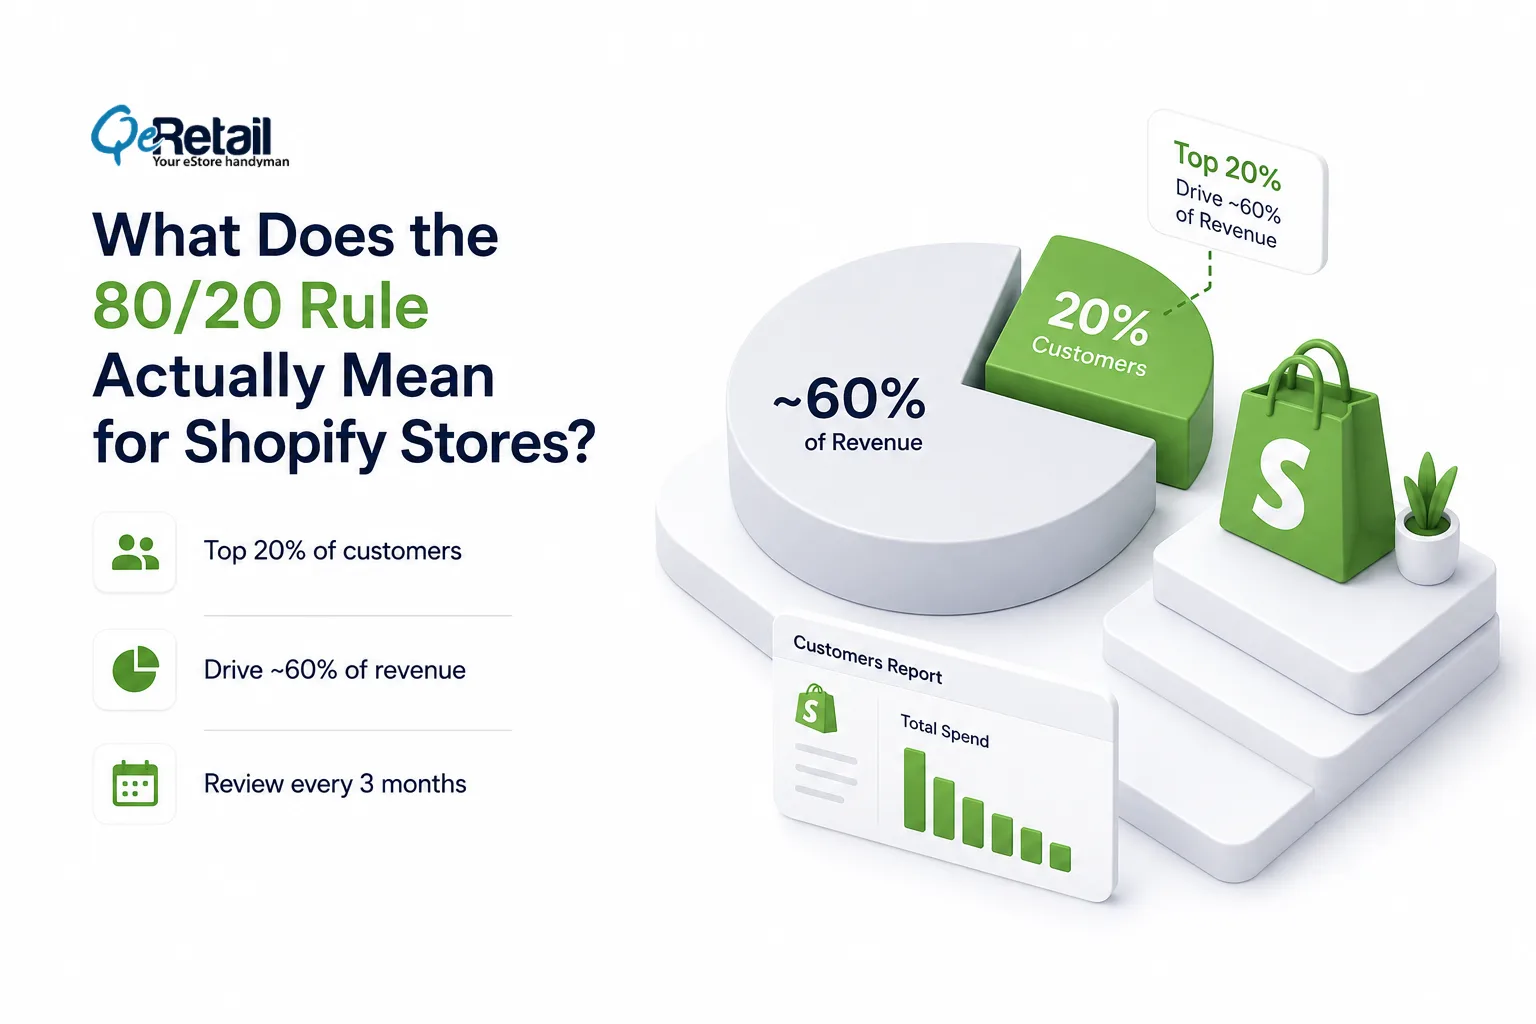
What Does the 80/20 Rule Actually Mean for Shopify Stores?
The 80/20 rule sounds simple. It almost never plays out that cleanly inside a real Shopify store. The idea that 20% of your customers bring in 80% of your money is a useful starting point, but the real split is 60/20, and it changes what you should do next.
The Real Split Inside Most Stores
Most store owners assume the math is neat. It rarely is. Research from Byron Sharp, cited in the Journal of Marketing Management (2025), found the real pattern sits closer to 60/20, where the bottom 80% of shoppers still bring in nearly half of total sales.
So your “everyday” buyers matter more than the slogan suggests.
Your top group of customers still spends far more than everyone else, even when the exact ratio is off. Finding those people and keeping them coming back is the single most valuable thing you can do as your store grows.
Expert Take: Chasing a perfect 80/20 number is a trap. What matters is knowing exactly who your best customers are, by name, by group, and by what they buy. A store with a 60/20 split that knows its top 20% and treats them well will beat a store with a textbook 80/20 split.
Quick Wins:
- Open your Shopify Customers report and sort by Total Spend.
- Work out what share of your total revenue comes from your top 20% of customers.
- Check that same number every three months.
Why Can’t Most Stores Answer This Question Today?
Stores doing $100K to $500K a year are not short on data. They are short on a clean way to see it. Shopify shows you total revenue, average order value, and repeat purchase rates out of the box.
What it does not show you by default is a ranked list of your best customers with their buying habits attached. That gap is the whole problem.
Expert Take: Running “come back” ads at your best customers is worse than wasteful. It quietly damages the relationship you built with them. Imagine someone spends $800 in your store, then gets served a “15% off, new here?” ad.
Quick Wins:
- Build an exclusion list in your Meta and Google Ads accounts.
- Open your email flows and confirm your best buyers get loyalty and thank-you messages.
- Set a monthly calendar reminder to export and review your top 20% list.
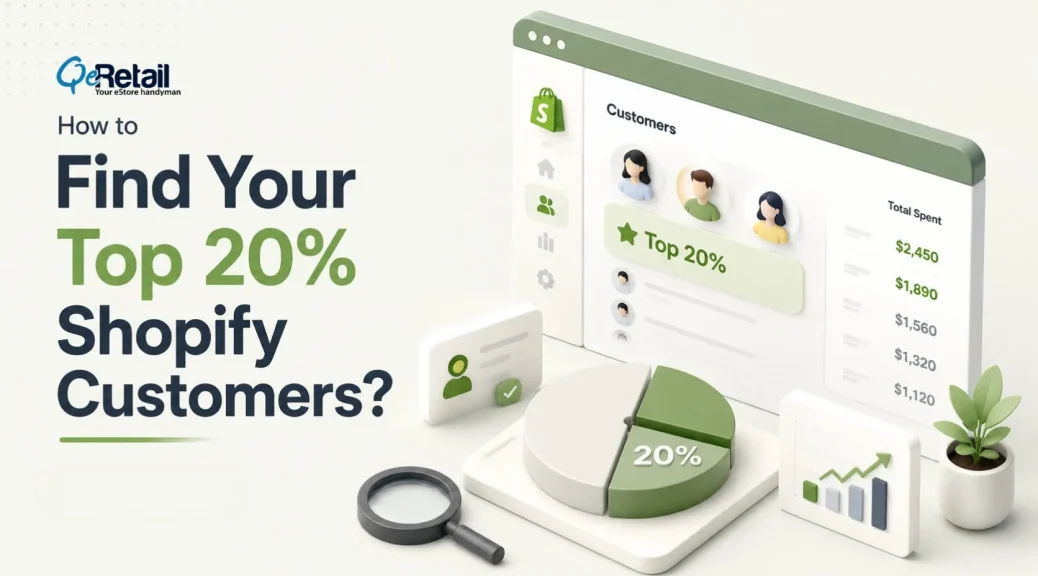
How to Find Your Top 20% Customers Using Shopify’s Built-In Tools?
You do not need a paid analytics app to start. Shopify already holds the data. When used correctly, your built-in reports show you exactly who your best customers are.
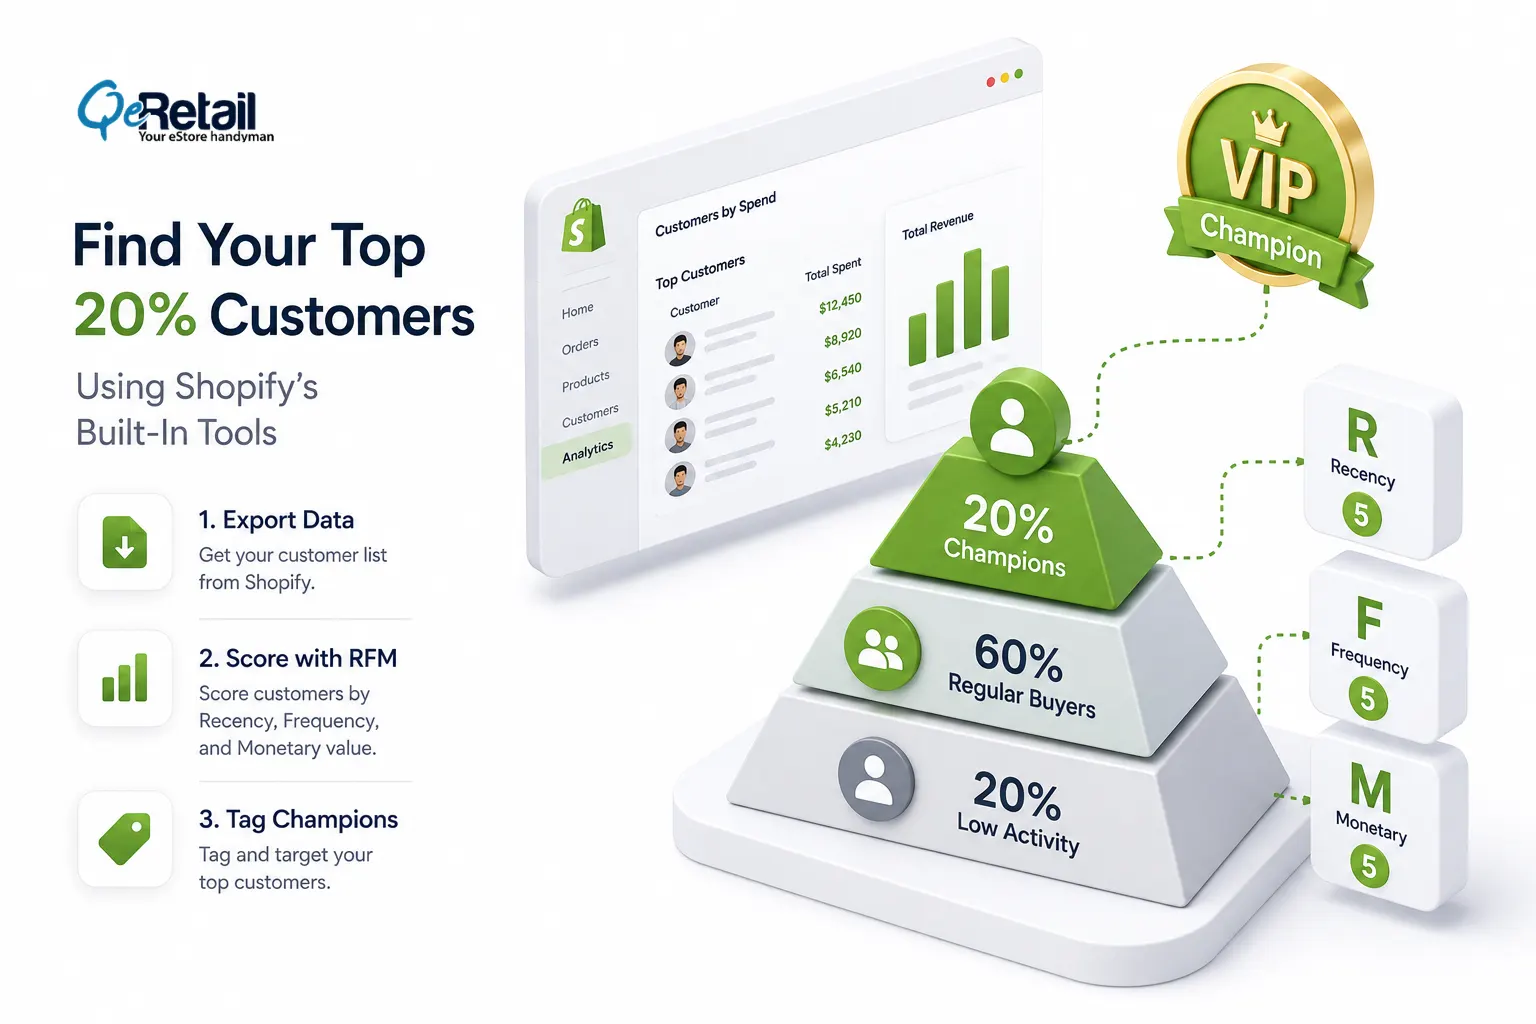
Step 1: Pull Your Customer List Out of Shopify
Your highest spenders are sitting in plain sight. You just have to sort them.
- Open Shopify Admin, go to Analytics, then Reports.
- Look under the Customers section and open the Customers by spend report if your plan includes it.
- If you are on a Shopify Basic plan, go to “Customers,” click Export, choose All customers, and download the CSV file.
- Now open that file in Google Sheets or Excel.
- Find the column called Total Amount Spent and sort it from highest to lowest.
- Count how many names make up 20% of your full list.
- If you have 500 customers, that is your top 100. The names sitting at the very top are the people you want to protect.
Expert Take: Spending alone lies to you. A customer who dropped $1,200 in one order three years ago and never came back is not a VIP. That person is gone. To know who matters right now, you need to see how often someone buys, not just how much they once spent.
Quick Wins:
- Export your customer list with three columns visible: Total Amount Spent, Number of Orders, and Last Order Date.
- Add a new column that divides Total Spent by Number of Orders.
- Spot any top-20% spender who has not bought in the last 90 days.
Step 2: Score Each Customer With a Simple 1-to-5 System
This part sounds technical. It is not. You are just grading customers on three simple questions. The method is called RFM, which stands for Recency, Frequency, and Monetary value. This tackles questions like,
- How recently did they buy?
- How often do they buy?
- How much do they spend?
Research published on ResearchGate confirms RFM as one of the most dependable ways to sort ecommerce customers, and the model has been working since catalog retailers used it in the 1970s. It survived that long because it is easy.
Give every customer a score from 1 to 5 on each of the three questions:
| Dimension | Score 5 (Best) | Score 3 (Average) | Score 1 (Worst) |
|---|---|---|---|
| Recency (R) | Ordered in the last 30 days | Ordered 60 to 90 days ago | No order in 180+ days |
| Frequency (F) | 5 or more orders lifetime | 2 to 3 orders lifetime | Single purchase only |
| Monetary (M) | Top 20% by total spend | Middle 60% by spend | Bottom 20% by spend |
Now read the scores. Customers who score 4 or 5 on all three questions are your Champions. These are your real top 20%, the people who buy often, spend well, and have bought recently.
Customers who score high on frequency and monetary but low on Recency are your at-risk champions. They used to love you. They have gone quiet. Reach out before they buy from someone else.
Expert Take: Most stores score their customers once, feel clever, and never look again. That is the mistake. Your Champions list goes stale fast. The buyer who topped your list six months ago may have quietly stopped shopping.
Quick Wins:
- Build your RFM scoring in the same spreadsheet you exported, using the table above as your guide.
- Tag your Champions inside Shopify using “Customer Tags” so you can email and target them as a group going forward.
- Block 30 minutes on the first of every month to re-score and refresh tags.
What Makes Top 20% Customers Different: Audit Findings from 140 Shopify Stores
QeRetail completed structured RFM audits for 140 Shopify stores, ranging in $80K to $1.8M in annual revenue, in the health and wellness, pet care, apparel, and home goods verticals over the three-year period (2023-2025). The results below are patterns that we observed, and do not reflect an average number of third-party surveys.
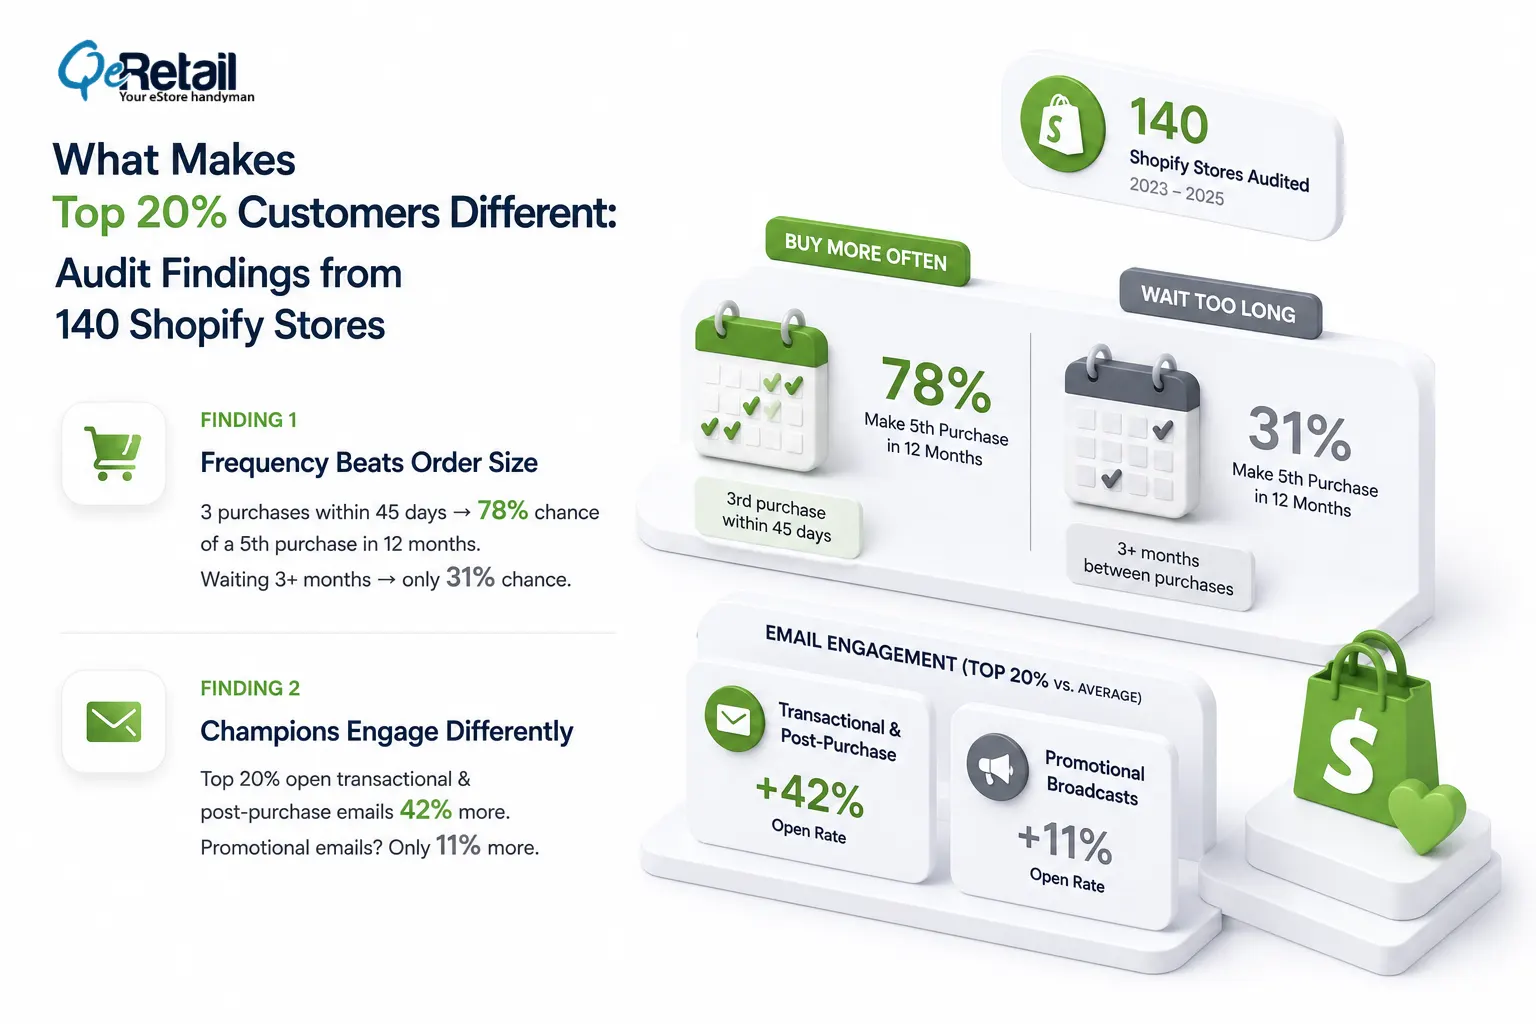
Finding 1: Purchase Frequency Predicts Lifetime Value More Than Order Size
Across the 140 stores audited, customers who made their third purchase within 45 days of their second purchase had a 78% probability of making a fifth purchase within 12 months.
Those who had been waiting over 3 months from the second to third purchase had just a 31% chance of making a fifth purchase.
A true rule of thumb in the retail industry is that a customer who makes three purchases of $60 within 60 days is worth more over a 12-month period than a customer who makes one purchase of $250 and never returns again.
Finding 2: Champions Engage Differently Across Email Content Types
In 18 stores where we had access to both Shopify analytics and Klaviyo email data, we found that the top 20% of customers by revenue opened transactional and post-purchase emails at a 42% higher rate than the general subscriber list.
However, they opened promotional broadcast emails at only 11% higher than the average.
Your best customers are not more receptive to marketing. They are more engaged with your brand story and post-purchase content. Sending them the same weekly promotional email you send first-time visitors is a misuse of that relationship.
Signals That Identify a Top 20% Customer: A Diagnostic Reference
The following table summarizes the behavioral signals we consistently observed in Champions across our 140-store audit. Use this as a checklist when reviewing customer profiles manually or building filter criteria in your Shopify segments.
| Signal | Champion Profile | Average Customer | Risk Flag |
|---|---|---|---|
| Orders (lifetime) | 4 or more | 1 to 2 | 1 order, high spend |
| Days since last order | Under 60 days | 90 to 150 days | Over 180 days |
| AOV vs store average | 1.4x or higher | At or near average | Below average |
| Product category breadth | Buys across 2+ categories | Single category | Single SKU repeat only |
| Post-purchase email opens | Above 35% | 12 to 18% | Under 5% |
| Review or UGC activity | Has left a review | No review activity | Active refund history |
Stop Treating Every Customer the Same. Start Building Around Your Best.
The most common mistake Shopify stores make at the $100K to $500K revenue stage is operating a single customer list with a single marketing strategy. Every customer gets the same email. Every customer sees the same ad. Every customer receives the same discount.
That approach made sense when your list was 200 people. At 2,000 customers, it means you are spending the same energy on a one-time buyer who found you through a discount code as you are spending on the person who has purchased from you seven times and opened every email you have ever sent.
Your top 20% customers are not just your best buyers. They are your most reliable revenue base, your highest-probability referral source, and your most cost-efficient marketing channel if you treat them correctly.
Finding them inside Shopify takes less than two hours using the methods in this guide. What you do with that list after you build it determines whether your store compounds or stagnates.
Book a free consultation, and we will run a complimentary RFM audit on your Shopify store to identify your Champions segment and show you the specific retention gaps costing you recoverable revenue.
Frequently Asked Questions
What Percentage of My Shopify Customers Should I Consider My Top Tier?
A practical starting point is 20% of your total customer count, sorted by lifetime spend. Our audits of 140 Shopify stores found that this cohort typically accounts for 58 to 71% of total store revenue, depending on product category. If your store has fewer than 500 total customers, start with your top 50 by name and review them manually before applying percentage-based segmentation.
Can I Identify My Top Customers Without a Paid Analytics Tool?
Yes. Shopify’s native customer export provides enough data to build a basic RFM segmentation manually using a spreadsheet. Export your customer list from the Customers section, sort by Total Amount Spent, add a column for purchase frequency using the Order Count field, and add a Recency filter using Last Order Date. No third-party app is required for your first segmentation pass.
How Often Should I Update My Top Customer Segment?
Monthly updates are the minimum for stores doing $200K or more annually. Customer behavior shifts quickly. A Champion who purchased four times in one year can go dormant within 90 days if they receive irrelevant communication or find a competitor. We recommend setting a monthly recurring calendar task to re-export and re-score your customer list using your RFM criteria.
What is the Best Way to communicate with My Top 20% Customers Differently from the Rest of My List?
The most effective approach documented across our client base is a separate email flow built specifically for Champions, with content focused on early access, product previews, and brand recognition rather than discounts or promotional offers. Champions already buy. The goal of Champion communication is to deepen loyalty and referral behavior, not to drive the next transaction with an incentive.
How Long Does It Take to See Results from Vip Segmentation?
In our data across 31 client stores where we implemented a structured Champions segment, the average time to a measurable increase in revenue contribution from that segment was 47 days. The fastest results came from stores that combined segmentation with a founder-written personal outreach email in the first week. The slowest results came from stores that built the segment but continued sending Champions the same promotional content as their general list.
Table of Contents