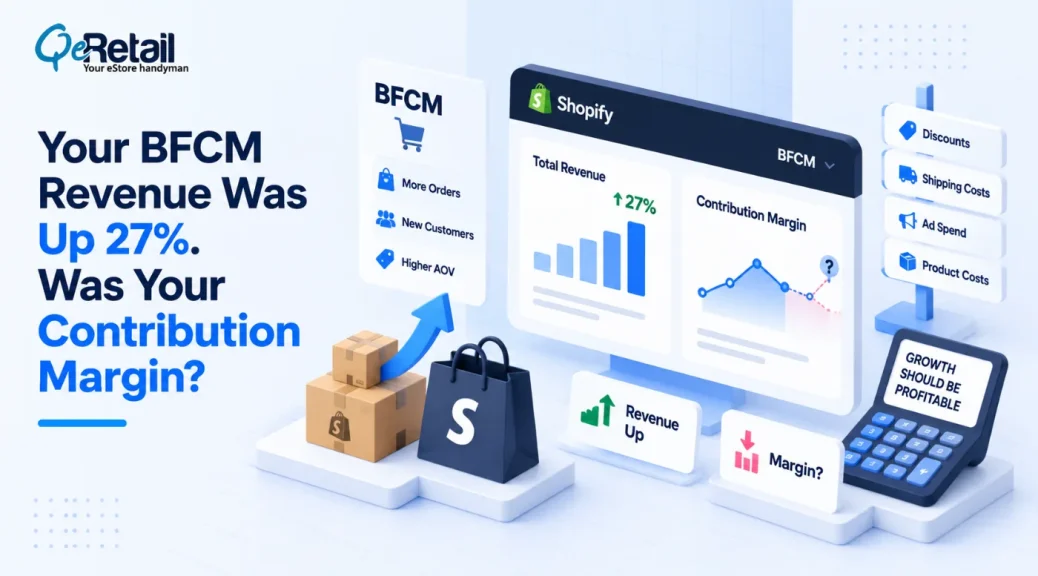
Shopify merchants moved $14.6 billion in Black Friday Cyber Monday sales, up 27% year over year, at an average cart price of $114.70. Your revenue dashboard may show the same curve. Your profit report might not.
Then January lands and the bank balance does not match the story.
The gap is not a reporting bug. It is that almost every BFCM decision gets made on revenue, while profit gets decided by four numbers most stores never put in the same sheet:
- Discount depth
- Blended shipping
- Fulfillment cost
- Ad spend on discounted orders
And what those buyers do in the next 90 days. Deep discounts do pull volume. The question is never whether discount shoppers are good customers. It is whether the discount changed enough behavior to justify the margin you handed over. This piece gives you the arithmetic to run before you set the percentage, and the cohort read to run after.
Key Action Points:
- Calculate contribution margin per order before you set the discount percentage, not after
- Model the discount and the shipping subsidy as one combined offer, not two decisions
- Set a floor discount your margin survives, then test above it
- Separate discounted-order CAC from your blended CAC in reporting
- Track 90-day repeat rate by cohort, split by discount depth
- Cap your deepest offer to slow-moving SKUs instead of the full catalog
- Kill any offer whose contribution margin lands under your fulfillment cost per order

What Makes a BFCM Discount Profitable?
A discount is not a marketing decision. It is a margin decision your marketing team happens to make. The only question that matters is whether the extra units sold cover the margin you gave away across every unit, including the ones that would have sold at full price.
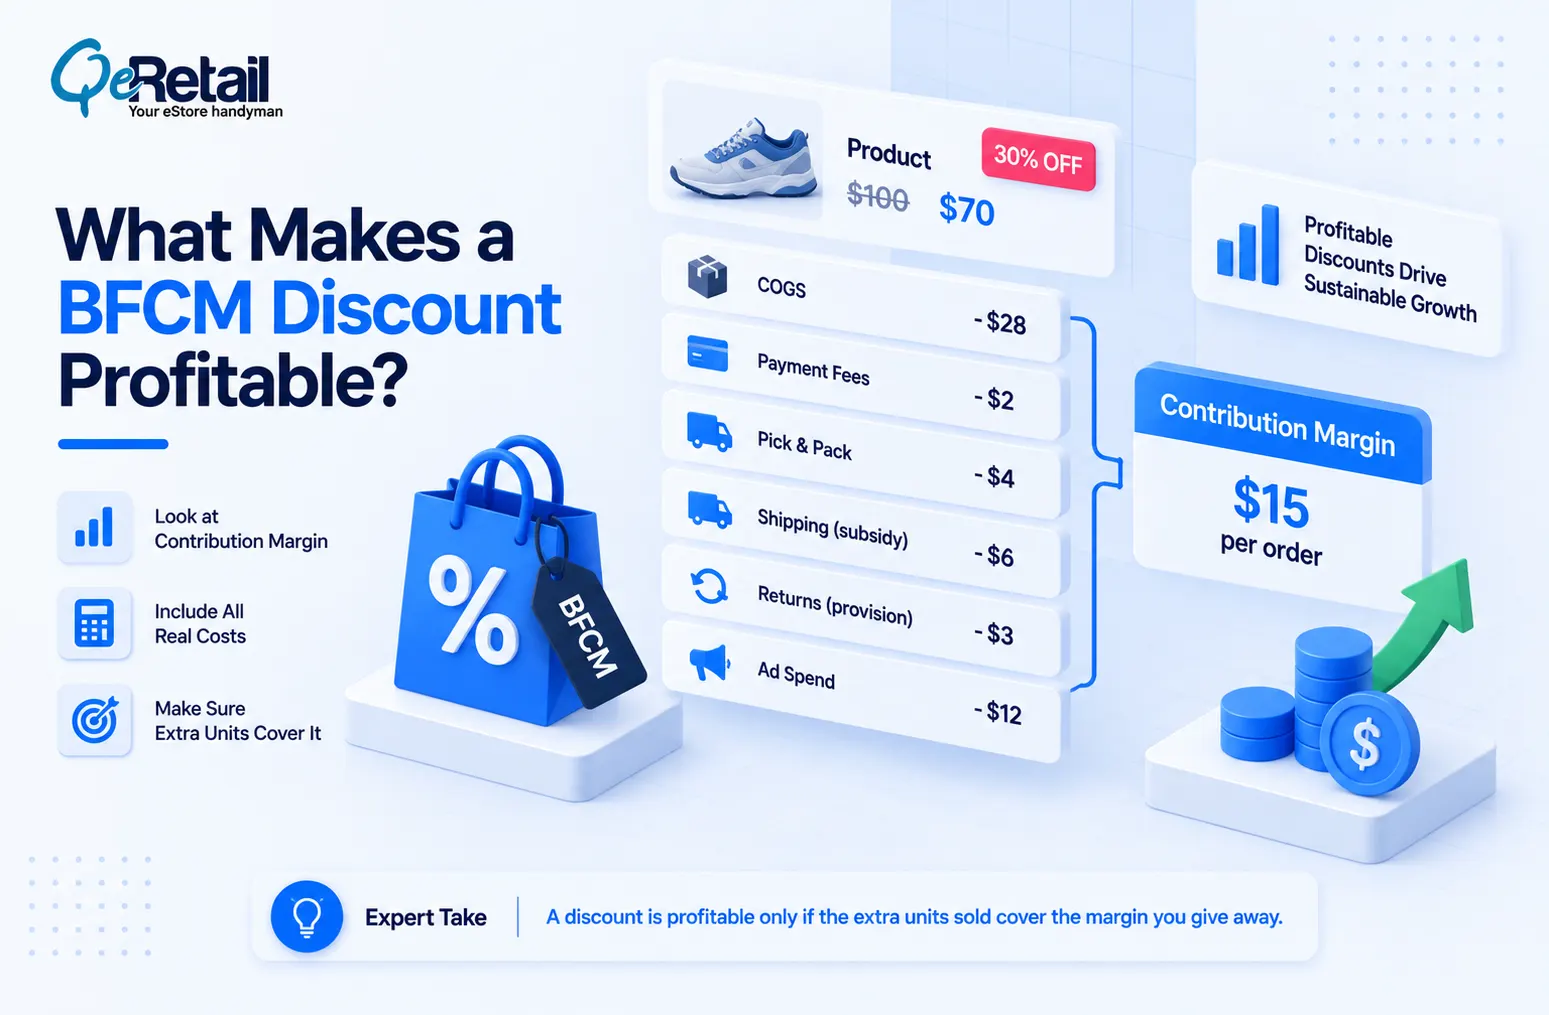
That last part is where most stores lose. A 30% sitewide offer discounts your bestseller to buyers who were already converting, and you pay for that out of the same pool funding the acquisition.
Contribution margin, not gross margin
Gross margin flatters a discount because it stops at COGS. Contribution margin keeps going: COGS, payment fees, pick and pack, shipping subsidy, returns provision, and the ad spend attributable to that order. Run it on a real order, and the shape becomes obvious.
The worked example: one $114.70 order at 30% off
Use Shopify’s reported $114.70 average cart price as the full-price line, then apply a merchant cost structure. Substitute your own figures; the structure is what matters.
| Line | Amount |
| Full-price order (average cart price) | $114.70 |
| Discount at 30% | -$34.41 |
| Discounted revenue | $80.29 |
| COGS (45% of full price) | -$51.62 |
| Payment fees (2.9% + $0.30) | -$2.63 |
| Pick, pack and fulfillment | -$4.00 |
| Shipping subsidy (free shipping) | -$8.50 |
| Returns provision (8% of revenue) | -$6.42 |
| Attributable ad spend | -$8.00 |
| Contribution margin | $12.13 |
So the order clears $12.13. At full price, the same order carries a 45% gross margin, no discount, and no shipping subsidy, which puts contribution near $34 after fees, fulfillment, returns, and the same $8 of ad spend.
That is the number that sets your break-even volume lift:
Required lift = full-price contribution ÷ discounted contribution = $34 ÷ $12.13 = 2.8x
You need 2.8 times the unit volume to end the weekend with the same profit you would have made selling nothing at a discount. If your best weekend ever was 1.8x, the 30% offer is already answered, and 40% is worse: at that depth, the same order structure lands close to zero contribution, where no volume lift recovers it.
Expert Take:
Model free shipping as part of the promotion, not as a separate fulfillment decision. In the table above, the $8.50 subsidy costs more than a third of what the 30% discount costs, and it is the half nobody prices. A 20% discount with a $9 subsidy on a $114 order is a 28% offer. Price it as one number, or you will keep approving discounts you never actually approved.
Quick Wins:
- Build one contribution margin line per SKU, not a store average
- Load real shipping cost per order from your current carrier rates, not last year’s card
- Add your trailing return rate as a cost, especially on apparel
- Compute the required volume lift for every discount tier before creative gets briefed
Why Most Shopify Stores Cannot Tell Profit From Volume
Because the demand arrives whether the discount earns it or not. McKinsey’s holiday shopping research found two-thirds of consumers planned to start shopping before Black Friday, and three-quarters planned to trade down. Deloitte’s 2025 survey reports 60% of shoppers had already loaded carts waiting for the weekend.
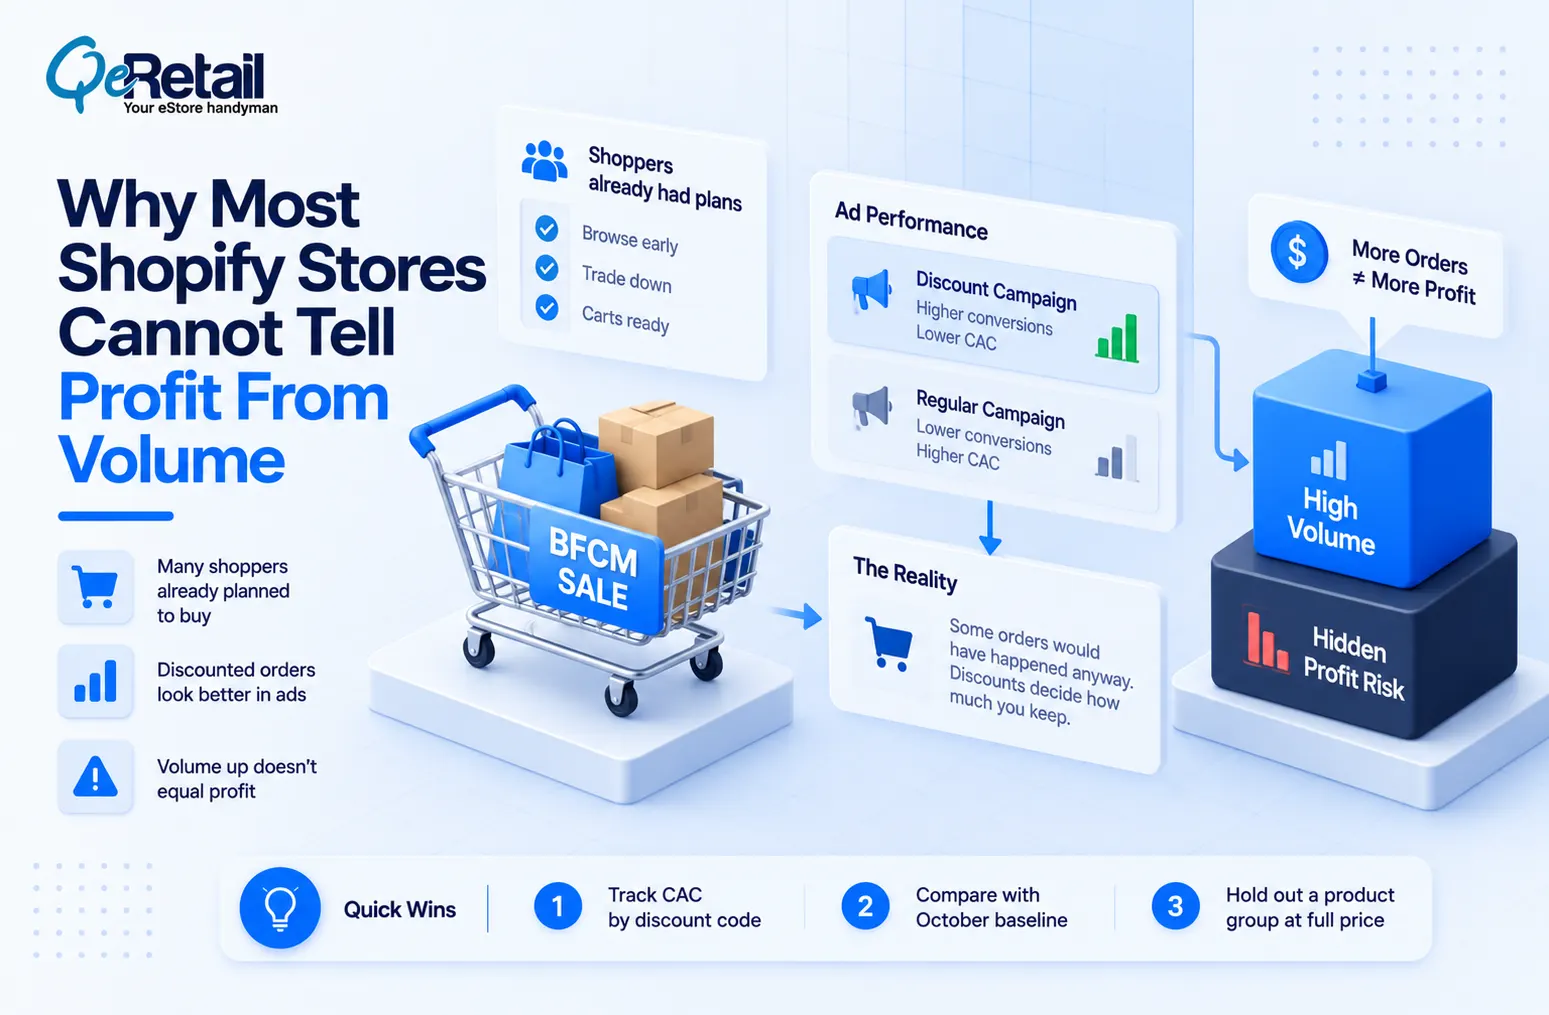
So a chunk of your BFCM revenue was going to happen anyway. Your discount just decided how much of it you kept. That is the incrementality problem in one sentence, and it is the mechanism the whole test below is built on: not how many orders arrived, but how many arrived because of the offer.
Attribution rewards the wrong offer.
Discounted orders convert faster and cheaper on ad platforms, so discount campaigns tend to surface as your best-performing spend in platform reporting. Treat that as an attribution risk rather than a result. A campaign pointed at people already holding a full cart will always look efficient, because the platform gets credit for a conversion it did not have to create.
Expert Take:
The single most useful number you can add before this BFCM is discounted-order CAC held separately from blended CAC. Blended CAC always drops in November. That drop is arithmetic, not performance, and it hides the offers that are quietly buying revenue at a loss.
Quick Wins:
- Tag every discounted order with the code used, then report CAC by code
- Compare BFCM-week CAC against your October baseline, not against last BFCM
- Hold back one product group or one region at full price so you have an incrementality read
- Stop paid support behind any code whose contribution margin is negative
4-Number Discount Test for Your BFCM Profitability Strategy
Run this before you commit a percentage. It takes an afternoon.
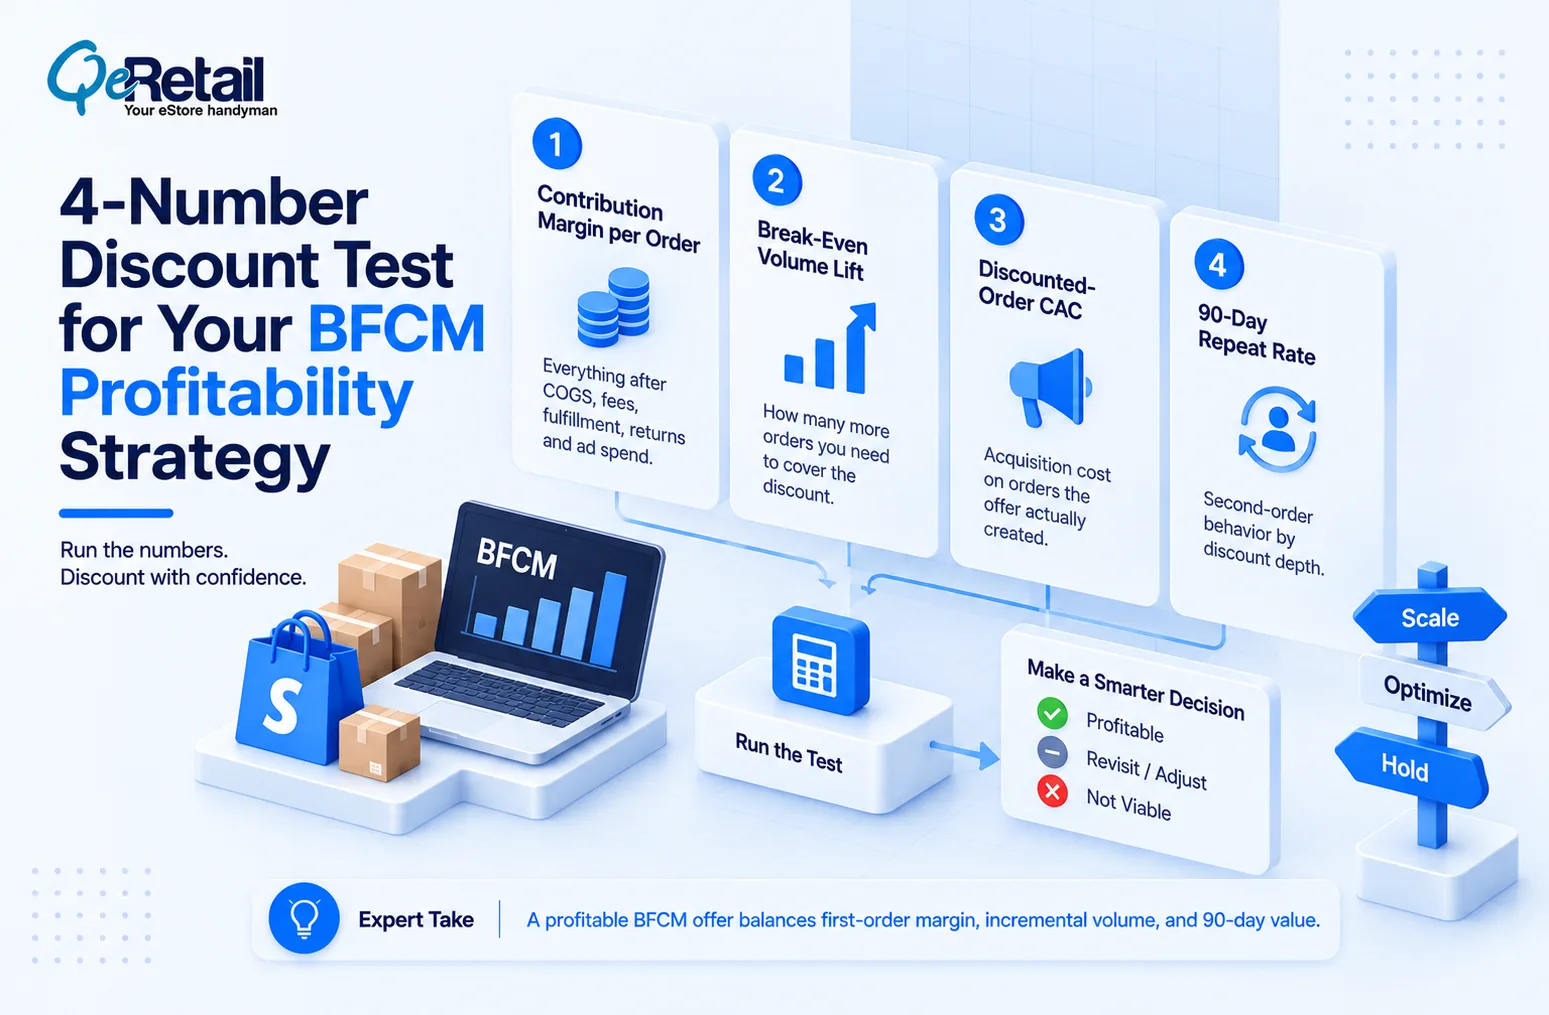
- Contribution margin per order at full price. Everything after COGS, fees, fulfillment, returns, and attributable ad spend. This is your ceiling.
- Break-even volume lift. Full-price contribution divided by discounted contribution, as calculated above. If a 40% cut needs a 2.5x lift and your best-ever weekend was 1.8x, stop there.
- Discounted-order CAC. Acquisition cost on the orders the offer actually created, not the blended figure.
- 90-day repeat rate by cohort. Second-order behavior, split by the discount depth the customer bought at.
Reading the Result
No single number returns a verdict. The promotion economics are the sum of three things: first-order contribution, incremental volume above what would have sold anyway, and the contribution those buyers deliver over the following 90 days.
A 90-day repeat rate matching your normal cohort is a strong input, not proof the promotion made money. If first-order contribution was negative and the volume lift fell short of break-even, a healthy repeat rate only means the loss is recoverable, and only if the cohort keeps buying at full price.
Conversely, a below-average repeat rate on an offer that cleared break-even on the first order is a margin note, not a failure.
Expert Take:
A discount that loses money on the first order and wins on the third is a valid strategy. A discount that loses money on the first order and never sees a third is a cost pretending to be a campaign. You cannot tell which one you ran until 90 days after the weekend, so build the cohort report now, in September, while it is cheap to set up.

What to Do at Your Revenue Tier
The thresholds below are operating heuristics, not benchmarks. They track where the constraint changes: at low volume you cannot absorb a bad sitewide offer; in the middle you gain enough catalog spread to discriminate by SKU. And above that, you have the cohort volume to run BFCM as an acquisition channel with a payback window. Move the boundaries to fit your own order volume and margin structure.
Under roughly $200K: fix the floor first. You do not have the volume to absorb a bad sitewide offer. Set a single contribution margin floor, then keep every BFCM offer above it. Bundle two products instead of cutting one, so cart value carries the margin.
Roughly $200K to $400K: split the catalog. Deep discount only slow SKUs and overstock. Protect bestsellers at 10 to 15%, because those buyers were converting anyway. Run the four-number test per product group, not per store.
$400K+: treat BFCM as an acquisition channel with a payback window. Accept a thin first order on a defined set of products, hold back a control group so you can measure incrementality, then hold the cohort accountable at 90 days.
Post-purchase flows and product data now do more margin work than the discount itself, because they are where the second order comes from, and the second order is where a thin BFCM cohort turns profitable.
What Can Shopify Store Owners Do?
Pick the tier you are actually in, not the one you are targeting, and set the discount ceiling from your contribution margin floor before any creative gets briefed.
Final Thoughts
Most stores set the percentage by looking at what competitors did last year, then measure the weekend on revenue. That is not a pricing strategy. That is matching.
If your BFCM ended with record revenue and you still cannot say which offer earned its margin, you did not run a promotion; you ran a sale on your own profit. The stores that win the next three years are the ones building the contribution and cohort math once and reusing it every season, because the advantage compounds while everyone else re-guesses each November.
Not sure whether last year’s discount actually made money?
Book a free consultation, and we will run your contribution margin, break-even lift, and 90-day cohort numbers against your real BFCM data before you set this year’s offer.
Frequently Asked Questions
What Discount Percentage Is Profitable For a Shopify Store?
How Do I Measure BFCM Profitability Instead Of Revenue?
Does Free Shipping Count As Part Of The Discount?
How Do I Know Whether The Discount Was Incremental?
How Long Should I Wait Before Judging a BFCM Campaign?
Table of Contents