In today’s digital age, understanding customer behavior on your website or app is crucial to delivering a positive user experience and maximizing conversion rates. Heatmaps provide a powerful tool for visualizing customer behavior and identifying areas for improvement.
According to a study by Eyequant, website visitors spend an average of just 5.59 seconds looking at a website’s main image, and 76% of website visitors scan a page and don’t read it in detail.
With heatmaps, you can quickly and easily identify which areas of your website are getting the most attention and optimize your layout to improve engagement and conversion rates. In this blog, we’ll explore the different types of heatmaps, how they work, and how you can use them to gain insights into customer behavior and improve your user experience.
What is a Heat Map?
A heat map is a data visualization technique. Numerical data is represented by variations in color and hue, giving an obvious indication of what values are high or low relative to each other. Generally, a heatmap scale consists of colors ranging from red to blue and is inspired by the way images are captured by the infrared camera — hence the word “heat.”
Heat maps use colors to show the relative frequency or intensity of specific values within a set of data. In eCommerce, heat maps can be used to analyze customer behavior on a website, such as
- where they click,
- how long they stay on certain pages, and
- what products they view most often.
By using heat maps, eCommerce businesses can identify patterns and trends in customer behavior and use this information to optimize their website design and product offerings for better conversion rates and sales.
How Do Heat Maps Work?
Heatmaps provide a powerful data visualization tool and can be used to visualize a wide range of data types, providing insights into patterns and trends that might not be apparent from simple tables or charts.
- Heatmaps use color to represent data values on a two-dimensional grid.
- Each data point is represented by a colored rectangle, with darker colors indicating higher values and lighter colors indicating lower values.
- Heatmaps can be used to visualize a variety of data types, including user behavior, demographics, and sales data.
- Heatmaps can provide insights into patterns and trends in data that might not be apparent from simple tables or charts.
- Different types of heatmaps, such as click heatmaps and scroll heatmaps, can provide different insights into user behavior on websites and apps.
Types of heatmaps
There are several different types of heat maps. Each type of heatmap provides unique insights into the data and can be used to make informed decisions about marketing, sales, and business strategies.
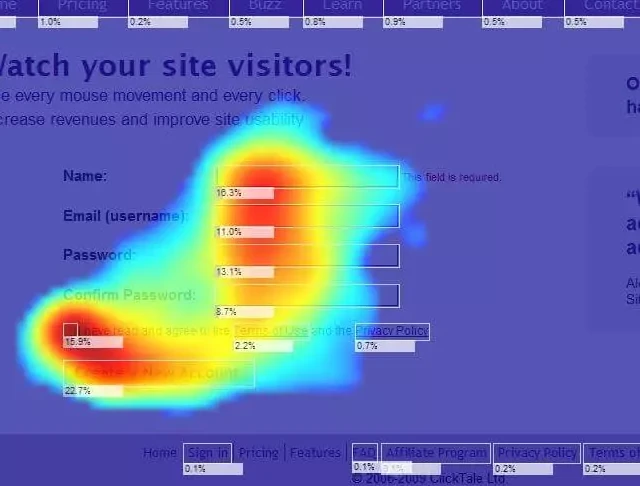
Click Heatmaps:
These heatmaps show where customers click on a webpage.
By analyzing which links, buttons, or images are the most popular, you can optimize your website’s layout to make it more user-friendly.
Scroll Heatmaps:
These heatmaps show how far down the page customers scroll.
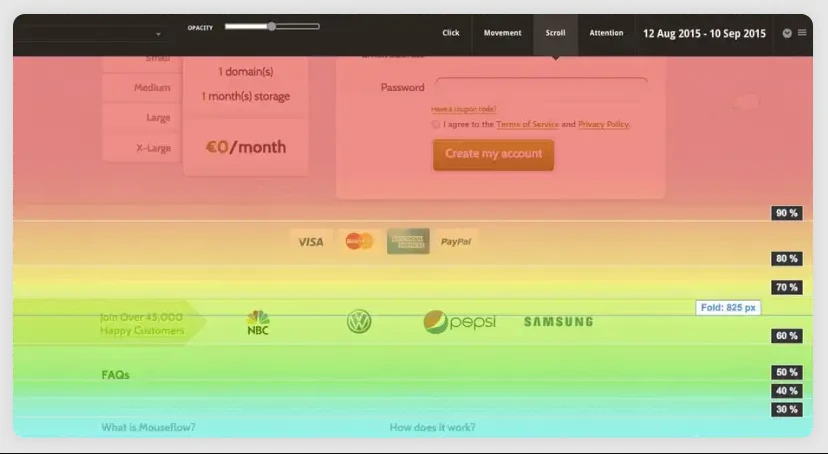
This can help you identify which sections of your website are most engaging and which ones are being overlooked, allowing you to adjust your content accordingly.
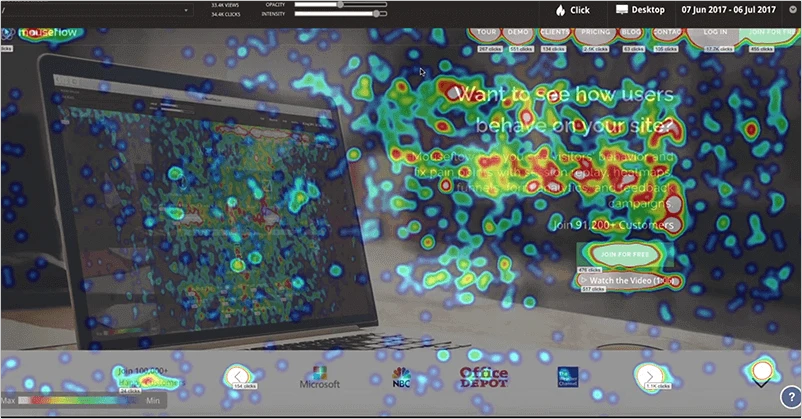
Mouse Movement Heatmaps:
These heatmaps track where customers move their cursor on a webpage.
This can help you identify which areas of your site customers are most interested in or frustrated with and optimize your website for a better user experience.
Conversion Rate Heatmaps:
These heatmaps show where customers are dropping off during the checkout process.
By identifying areas of confusion or friction, you can optimize your website’s checkout process to increase sales.
Time-based Heatmaps:
These heatmaps can help you identify trends in customer behavior over time, such as peak shopping hours or which products are most popular during certain seasons.
This information can be used to inform marketing and sales strategies.
By understanding your customers’ interactions with your website, you can create a more effective and engaging online experience that drives sales and improves customer satisfaction.
Benefits of Using Heat Maps
Heat maps use color to represent data and provide a simple and intuitive way to understand patterns and trends. With just a quick glance, you can see where users are clicking, scrolling, and spending the most time on your website.
Easy to Understand:
Easy to Understand: Heat maps provide a visual representation of data that’s easy to understand. You don’t need to be an expert in data analysis to understand what’s going on with your site. Anyone can quickly see what’s working and what’s not.
Quick Problem-Solving:
With heat maps, you can identify issues with your website much faster than by looking at pages of data. This means you can quickly find and fix the problem, saving you time and money.
Better Communication:
Heat maps are a great way to communicate information between different parties, such as publishers and advertisers. Instead of providing confusing numbers, heat maps offer a better middle ground to convey important information.
Measure Growth:
Heat maps are a key tool for measuring your website’s growth. By analyzing user behavior, you can identify areas for improvement and make changes that will increase lead conversions, engagement, and awareness.
Real User Experience:
You can get valuable feedback from your website’s users through heat maps. This is much more valuable than attending courses or seeking professional advice. Heat maps provide firsthand information about what’s working and what’s not, so you can make changes that will improve the user experience.
Identify Audience Attention:
Heat maps help you understand what’s capturing your audience’s attention and what’s frustrating them about your site. By identifying these areas, you can make changes that will improve user engagement and satisfaction.
How to use heatmaps on different eCommerce pages
Heatmaps can be used on various pages of an eCommerce website to gain insights into user behavior and improve user experience, here are some ways to use them.
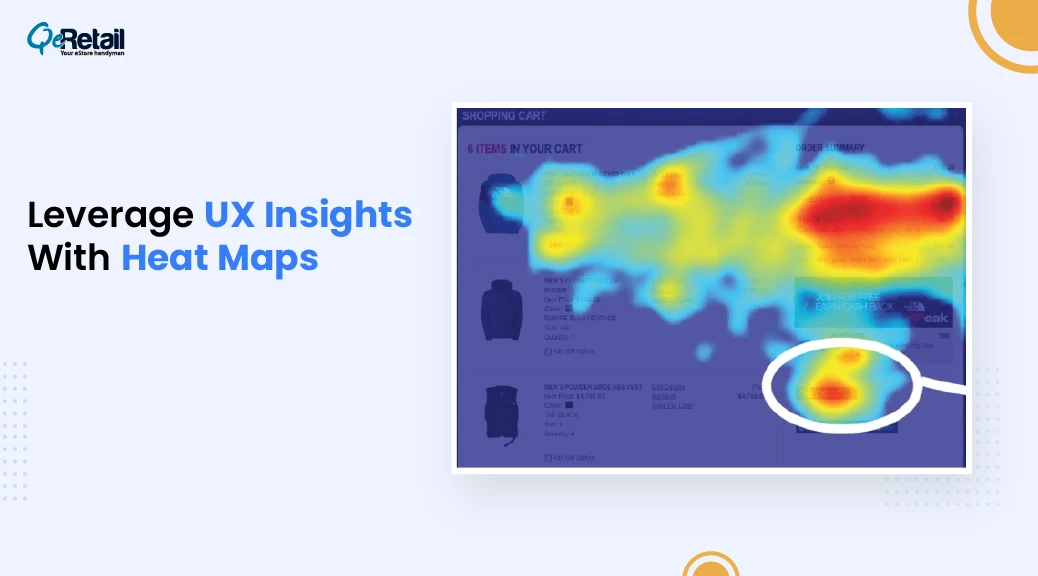
Studying cart page insights using heatmaps
Looking at the heatmap below, we can see that customers tend to click on the product image, cancel button, postcode section, ‘Go To Checkout’ icon, and discount codes. This data provides valuable insights that can be used to improve your website and increase conversions.
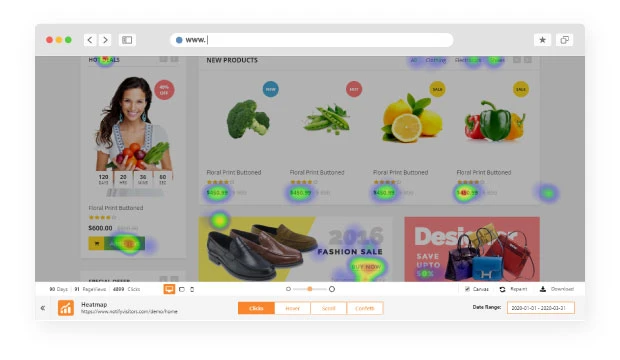
Such information helps you draw multiple conclusions. Some of these are as follows:
- Customers may want to review the product images before making a final purchase decision. If they cannot zoom in on the images, they may abandon their cart. Alternatively, they may remove items from their cart if they don’t like them.
- The discount code section appears to be of high interest to customers, indicating that offering discounts could increase sales. By analyzing these insights, we can draw hypotheses on how to improve page elements, enhance customer experience, and ultimately boost conversions.
Studying order page insights using heatmaps
One page that is often overlooked is the “My Orders” page. This page allows customers to view their current and previous orders, check delivery status, and seek assistance. By using heatmaps, you can see which elements on this page are getting the most attention from your customers.
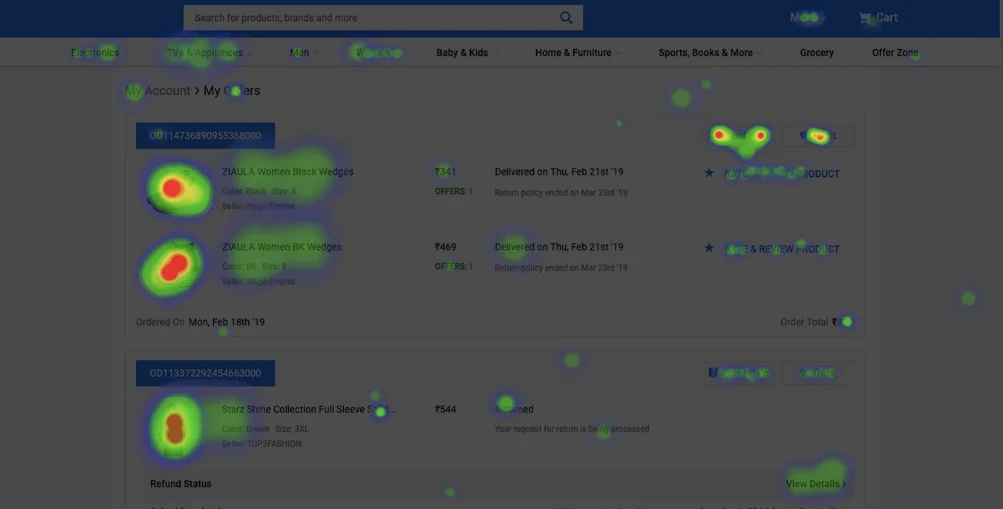
For example, the heatmap might show that customers are clicking on the “Track” icon, the “Need Help” button, and product images but not clicking on the “Rate & Review Product” icon. You can use it to improve the customer experience by adding pop-ups or call-to-action buttons to encourage customers to leave reviews.
If you want to stay ahead of the competition, it’s time to upgrade your platform with heatmaps.
Improving your website experience is essential to attracting and retaining visitors. Heatmaps show you which areas of your website are receiving the most attention and which ones are being ignored.
- If you notice that visitors are frequently clicking on a particular area, you might want to add more engaging features there.
- If an area is being overlooked, it may be best to remove it.
- If customers are struggling to find what they need, it might be time to reorganize your layout.
- You can accurately map the user journey, which will help you improve their experience.
By figuring out what customers like and where they are most interested, you can make changes that lead to improvements in your website’s conversion rate.
Conclusion
In conclusion, heatmaps are a potent tool for eCommerce website owners to gain valuable insights into user behavior, enhance website layouts, and inform marketing and sales strategies. Different types of heatmaps can provide a deeper understanding of customer behavior, preferences, and trends, enabling website owners to make informed decisions about growing their business in a competitive online world. By leveraging heatmaps’ power, eCommerce website owners can create a superior user experience and increase their revenue.
To get a comprehensive heatmap analysis, contact our experts today and elevate your success with QeRetail, your eStore handyman.
Table of Contents