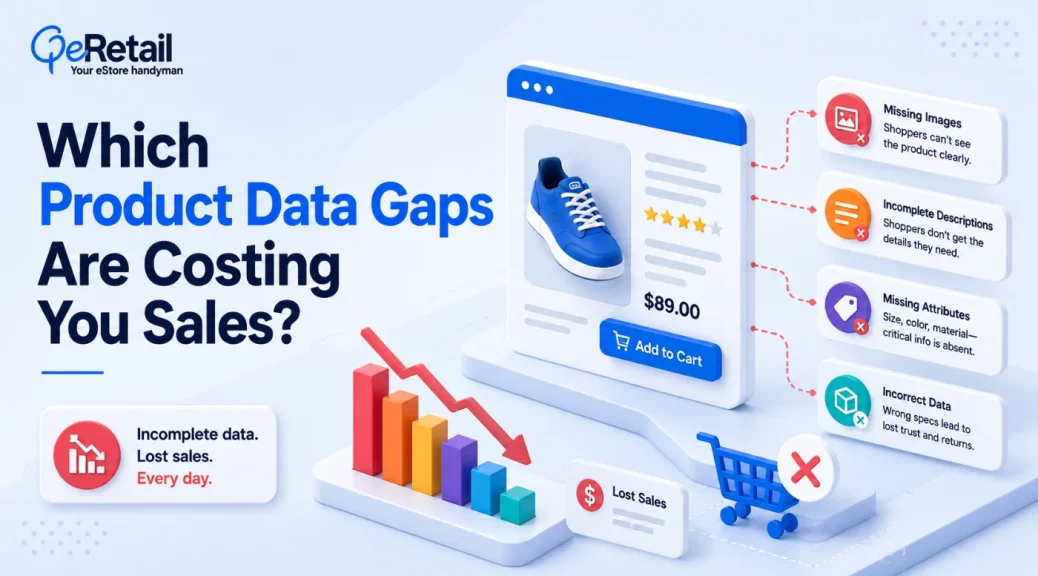
McKinsey research shows customer acquisition costs rose an average of 60% over the past five years, and most stores responded by spending more on ads instead of fixing what happens after the click. The result: real traffic arrives at product pages that are not ready to close the sale.
Most data-quality advice treats all gaps the same. It should not. A missing internal SKU code affects nothing a customer sees. A missing size chart kills a conversion. A misleading material description creates a return.
The question worth asking is not “Is my product data complete?” It is: which missing fields are actually blocking a purchase decision, increasing returns, or preventing products from being found?
This post gives you a framework for answering that question, and for prioritizing fixes by commercial impact rather than catalog coverage.
This Guide Covers:
- Why not all product data gaps cost you equally
- The three commercial failure types that actually hurt revenue
- How to prioritize which gaps to fix first
- A practical audit approach for your top SKUs
Key Action Points:
- Identify which of your top-traffic SKUs show signals of findability, decision, or expectation failure before running more paid traffic
- Run a cold-shopper audit on your highest-margin PDPs; it surfaces the gaps your own team has stopped seeing
- Fix structural data (taxonomy and attributes) first; content gaps compound on top of it
- Map return reasons to specific product data fields; most avoidable returns trace to a gap that was fixable before the purchase happened
- Evaluate a PIM based on catalog complexity (supplier count, channel count, update frequency, and attribute depth), not SKU count alone
Not All Product Data Gaps Cost You Equally
Product data quality means every attribute a customer needs to make a purchase decision is present, accurate, and consistently formatted. Not just title and price: size charts, material specs, use-case callouts, compatible variants, and the visual information that makes the difference between confidence and hesitation.
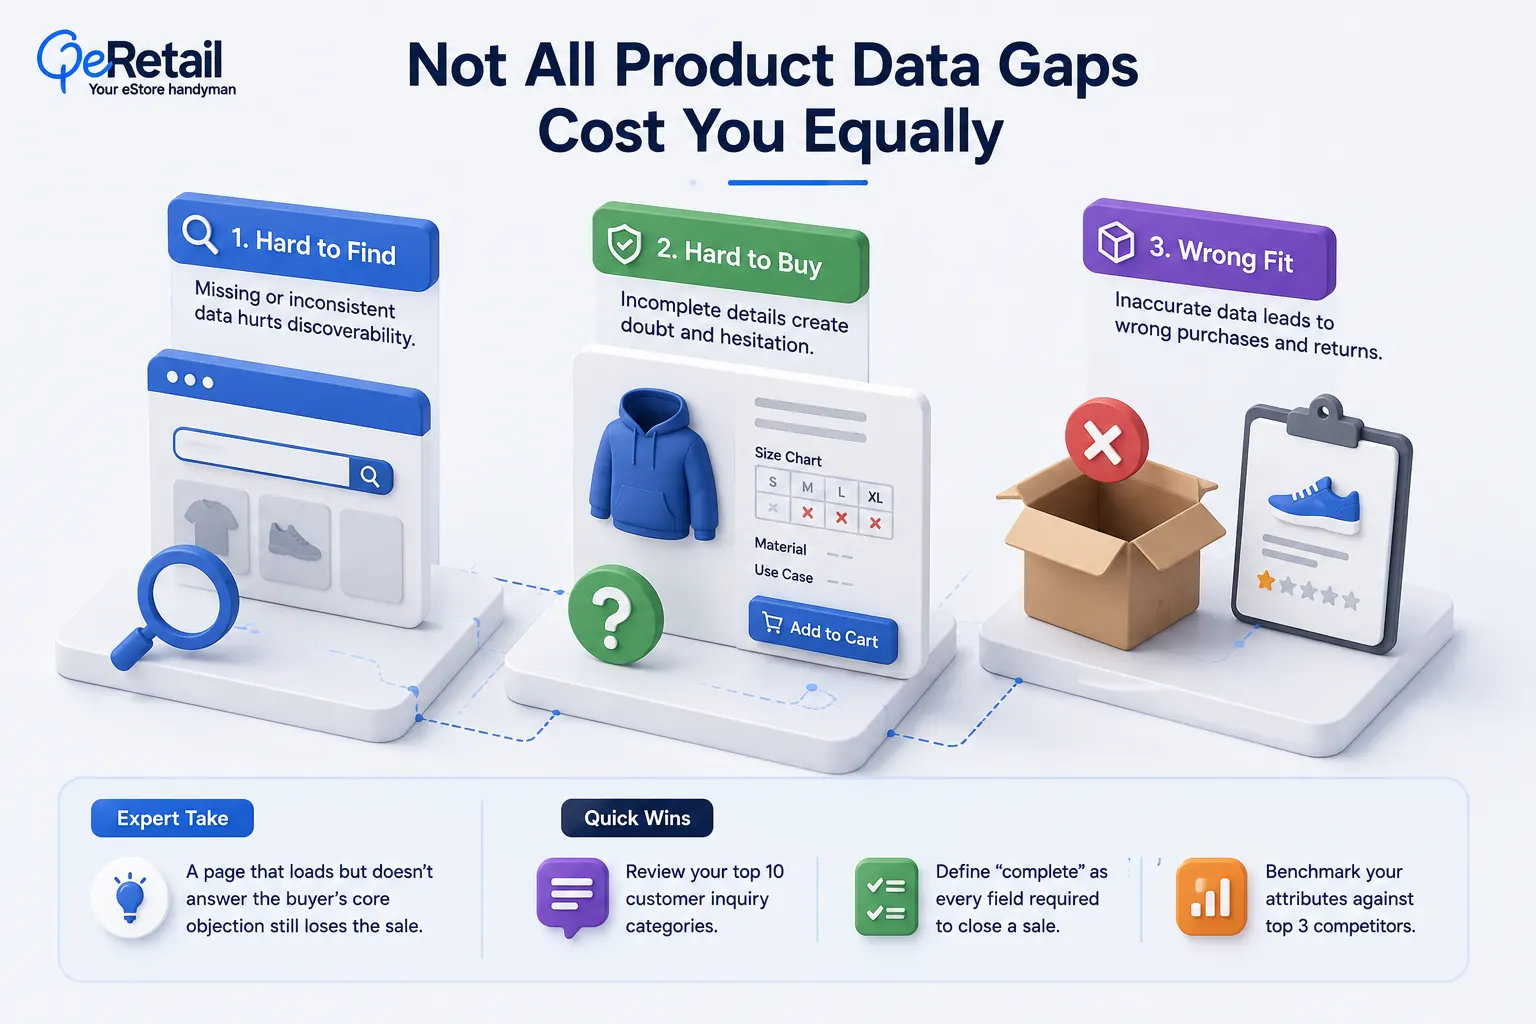
But treating all gaps equally is a mistake. Some missing fields are invisible to shoppers. Others are the direct reason a shopper leaves, buys the wrong item, or returns something that met the spec sheet but not their expectation.
The goal is to identify and prioritize the fields that do one of three things: prevent shoppers from finding your product, prevent them from confidently buying it, or lead them to buy something that does not match what they expected.
Expert Take:
Most stores define “complete” as “not throwing a 404.” That is live, not complete. A page that loads and still fails to answer the buyer’s core objection has the same conversion problem as a broken page; you just cannot see it in your error logs.
Quick Wins:
- Pull your top 10 customer service inquiry categories; they map directly to your most commercially significant data gaps.
- Define “complete” for your catalog as every field required to close a sale, not every field that exists.
- Compare your product attributes against the top three competitors in your category.
Why Bad Product Data is Hard to See from the Inside
not register as gaps; they register as “fine.” What your team thinks is on the page and what a cold shopper actually sees are often two different things. That perception gap is worth examining directly, not assuming away.
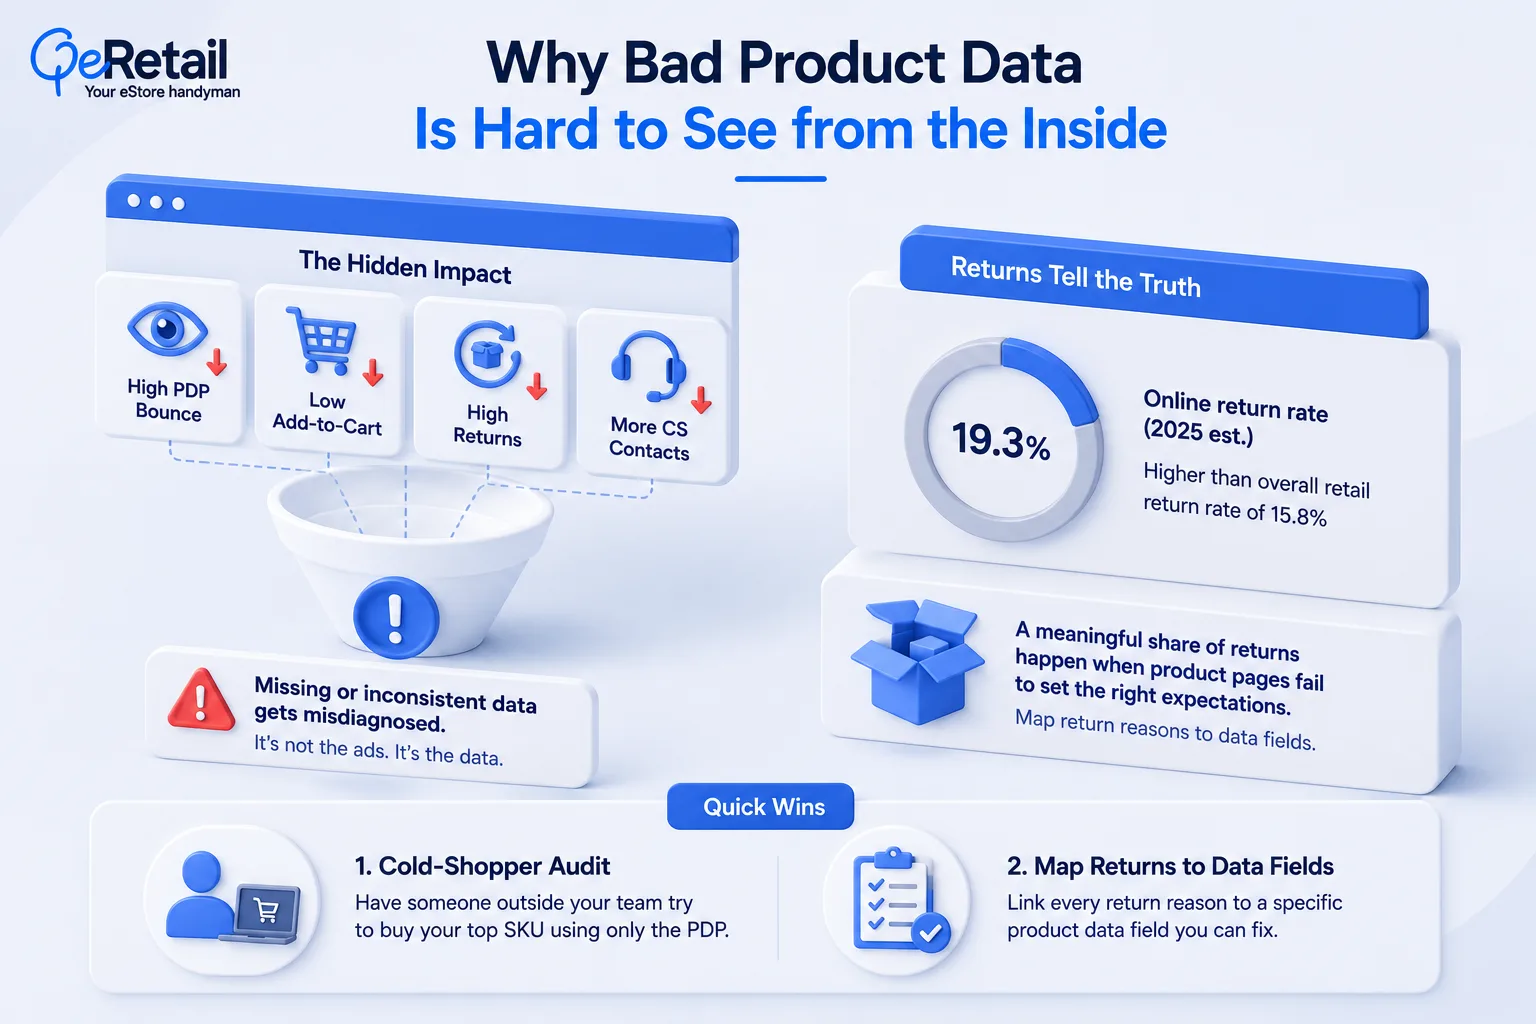
When product data is missing or inconsistent, the damage does not show up as a single failing metric. It spreads across your funnel: high PDP bounce rates, low add-to-cart, high return rates, repeat customer service contacts. Most of these signals get attributed to ads, seasonality, or price, not to the incomplete product page the traffic landed on.
Returns are a useful signal. Shopify reports that overall retail return rates reached approximately 15.8% of annual retail sales in 2025, with online return rates running higher at an estimated 19.3%.
A meaningful share of those returns trace to product pages that failed to set accurate expectations; identifying which ones requires mapping return reasons back to specific data fields, not just tracking aggregate rates.
Expert Take:
Pull up your top-traffic product page with no brand context, no prior knowledge, and try to complete a purchase using only what is on the page. Most teams find they cannot. That exercise reveals more than any analytics report.
Quick Wins:
- Run a cold-shopper audit: have someone outside your team attempt to buy your top SKU using only the PDP.
- Map every return reason to a specific product data field; most avoidable returns trace to a gap that was fixable before the purchase happened.
Three Commercial Failures and the Signals That Reveal Them
Product data breaks in predictable ways, and those ways have different commercial consequences. Understanding which failure type you are dealing with determines what you fix first and why it matters.
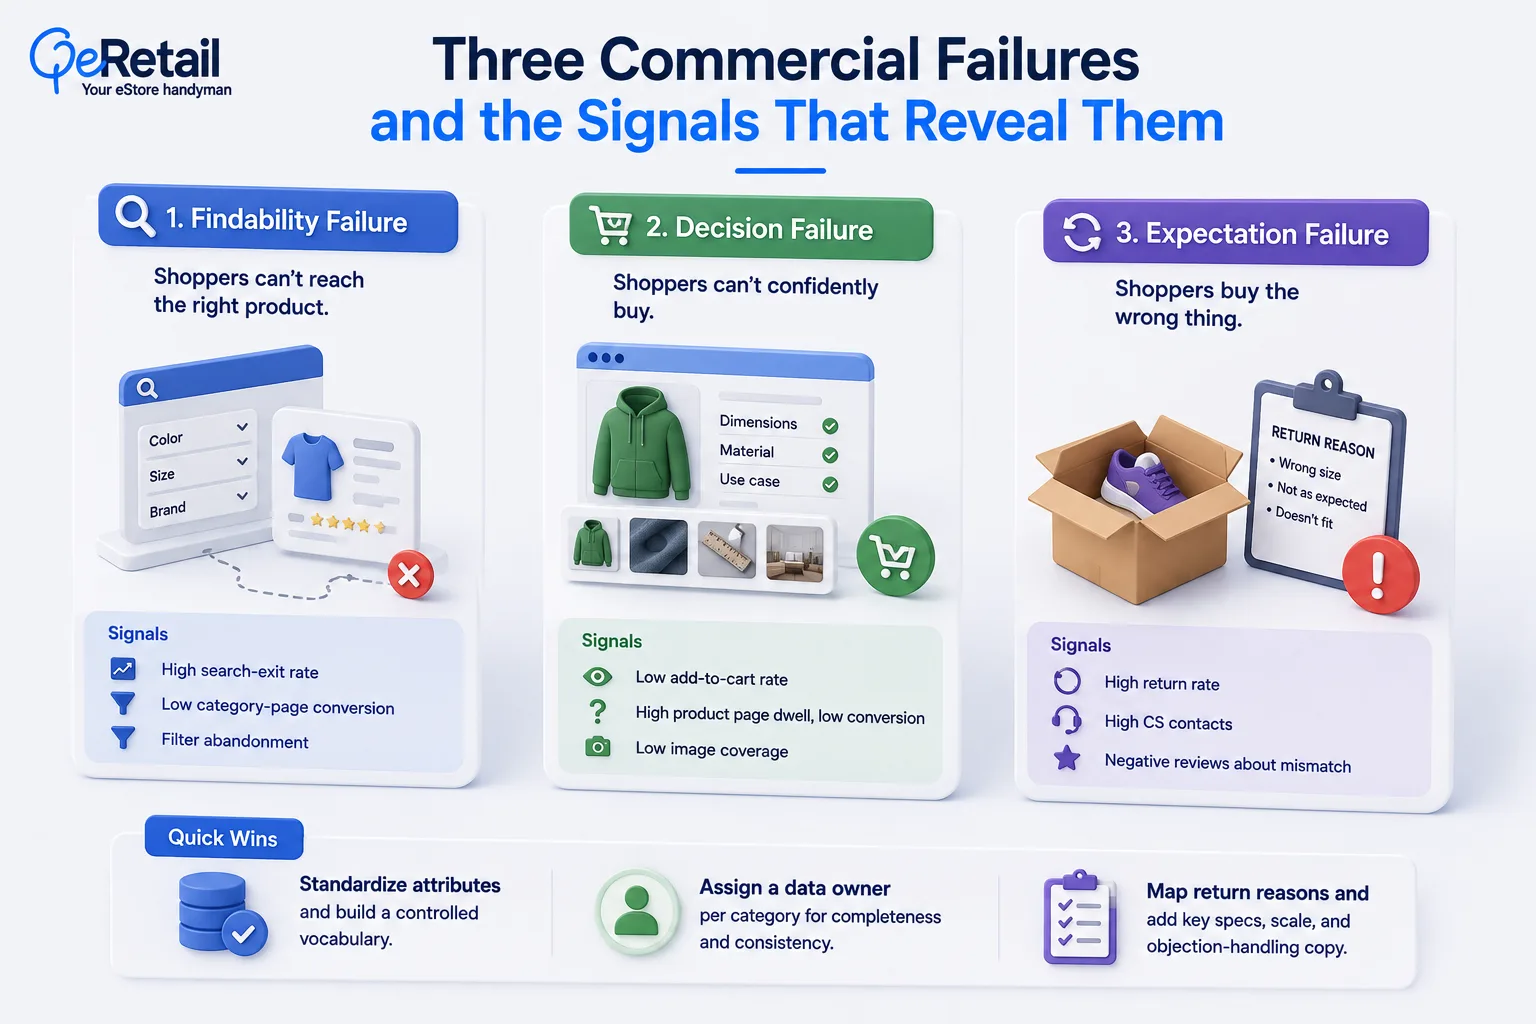
Findability Failure: Shoppers Cannot Reach the Right Product
Inconsistent attributes break filters. Poor taxonomy breaks search. Missing variant data means a shopper who wants the medium in blue never finds it, or finds it and cannot confirm it is the right one. This failure happens before a shopper ever reaches a PDP.
The signals: high search-exit rate, low category-page conversion, filter abandonment. Taxonomy decisions made at catalog launch compound for years. A store that used freeform color fields in year one is still paying for it in year three, every time a shopper filters by color and encounters 47 different spellings of the same shade.
Quick Wins:
- Standardize attribute values before your next product import, not after.
- Build a controlled vocabulary for every filterable field in your catalog.
- Assign a data owner per product category, someone responsible for field completeness and consistency.
Decision Failure: Shoppers Cannot Confidently Buy
This is where specs, dimensions, compatibility notes, use-case context, and visual information do or do not close the sale. A description that answers what a product is but not who it is for or why it matters right now is not closing anything. A product page with no scale reference, no lifestyle context, and no technical detail is asking the shopper to take a leap of faith.
At QeRetail, our audit benchmark is a minimum of four images per SKU; that is a starting point for identifying visual gaps, not a universal rule.
What matters is whether the images present answer the questions a cold shopper would bring to that specific product:
- What does it look like in use?
- What is the scale?
- What does the material or finish actually look like?
Missing visual angles can create an avoidable expectation gap. In categories where size, texture, or fit matters, gaps in image coverage reliably show up in return data.
For descriptions, the test is simple: read your five lowest-converting PDPs aloud. If the first two sentences do not tell a cold shopper exactly who the product is for, you have found your rewrite priority.
Copy that describes a product is not copy that sells it. The gap between describing and convincing is where purchase decisions die, and it is where most brands never look, because the page technically has something in the description field.
Quick Wins:
- Pull a SKU-level image count from your Shopify admin export; flag any SKU where image coverage does not address the core shopper questions for that product category.
- Add one scale-reference image to every product where size ambiguity is driving returns: accessories, home goods, electronics.
- Verify every variant has its own image, not a shared default.
- Build a three-field description template (use case, key spec, differentiator) and apply it to your ten lowest-converting PDPs before touching any ad targeting.
Expectation Failure: Shoppers Buy the Wrong Thing
This failure type shows up after the purchase: in returns, in customer service contacts, in reviews citing a mismatch between page and product. It is the most expensive failure because you paid to acquire the customer, fulfilled the order, and still lost.
Expectation failure almost always traces to a specific gap: a missing spec that led the shopper to assume wrong, an inaccurate dimension that made the product not fit, a lifestyle image without technical context that misled a buyer about the product’s scale or intended use.
Mapping your return reasons to your product data fields usually reveals a short list of high-priority fixes, not a catalog-wide remediation project.
Quick Wins:
- Pull your top five return reason codes and identify the product data field that should have answered each one.
- Add one sentence of objection-handling copy to your top ten SKUs based on your most common return reason.
- Check that every product page answers the question implied by your most frequent pre-purchase support inquiry in that category.

Why Bad Product Data is Hard to See from the Inside
Your team uploaded those descriptions. They know what the product is. So the gaps do
How to Prioritize: Traffic, Margin, and Failure Type
“Fix your top 20 SKUs” is a reasonable starting point, but it misses the nuance. Not every high-traffic SKU is high-margin. Not every high-margin SKU has a data gap worth fixing urgently. A more useful prioritization logic is:
Priority = Traffic Volume x Margin % x Commercial Failure Severity
Start with SKUs that score high on all three. Those are the pages where fixing a findability, decision, or expectation failure has the fastest and most measurable impact. A low-margin SKU with high traffic and a severe decision-failure problem still deserves attention, but after you have handled the high-margin SKUs where the same fix generates more profit per unit.
The most important discipline is tying fixes to measurable signals so you can verify the change worked. Conversion rate by SKU, add-to-cart rate, return rate by category, and pre-purchase support contact rate are the four metrics that tell you whether a data fix actually moved anything.
How to Product Data by Revenue Stage?
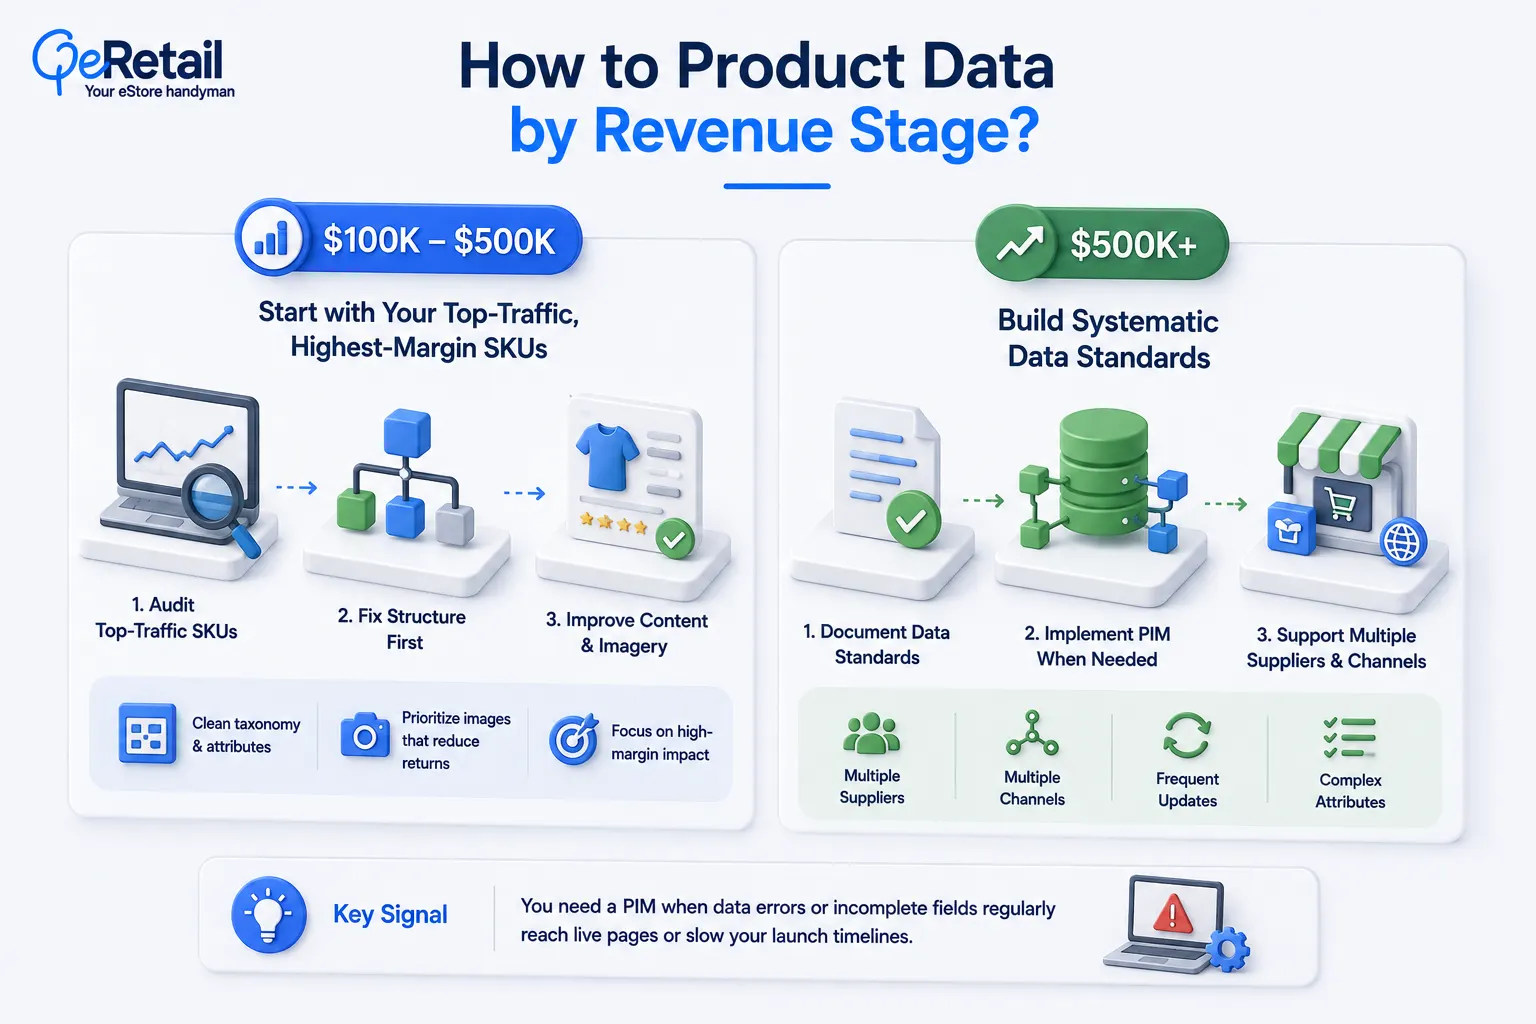
$100K to $500K: Start with Your Top-Traffic, Highest-Margin SKUs
Run the cold-shopper audit on the SKUs receiving the most paid traffic. Fix structural data first (taxonomy and attribute consistency) before addressing content gaps. Content built on top of broken taxonomy compounds the original problem. Prioritize imagery for categories where size, fit, or material ambiguity is driving returns.
$500K and Above: Build Systematic Data Standards
Scale with a documented data standard per product category. Consider a Product Information Management (PIM) system when catalog complexity makes manual governance unreliable, specifically when you have multiple suppliers, multiple sales channels, frequent catalog updates, or complex attribute sets.
SKU count alone is not the deciding factor: a store with 200 SKUs across four channels and six suppliers may need a PIM sooner than a store with 1,000 simple SKUs sold through one channel. The signal is when data errors or incomplete fields are regularly reaching live pages or slowing your launch timelines.

Fix the Pages You Are Already Paying to Send Traffic To.
The stores building compounding merchandising advantage are not the ones with the biggest ad budgets. They are the ones where a buyer lands on a PDP, and the page already knows what question they came to answer.
You did not invest in bad ads. You invested in ads that sent real buyers to incomplete product pages. That is fixable, and it costs less than the next campaign budget.
Book a free consultation, and we will audit your top-traffic PDPs for data completeness, identify which commercial failure type is affecting each one, and show you exactly where your catalog is losing conversions.
Frequently Asked Questions
What Is Ecommerce Product Data Quality?
How Do I Know If I Have Bad Product Data That's Impacting My Conversion Rate?
What Are The Priority Product Data Gaps To Be Addressed?
What Is a PIM and Would It Be Useful for My Shopify Store?
How Long Does It Take To Fix Product Data Quality Across A Shopify Catalog?
Table of Contents