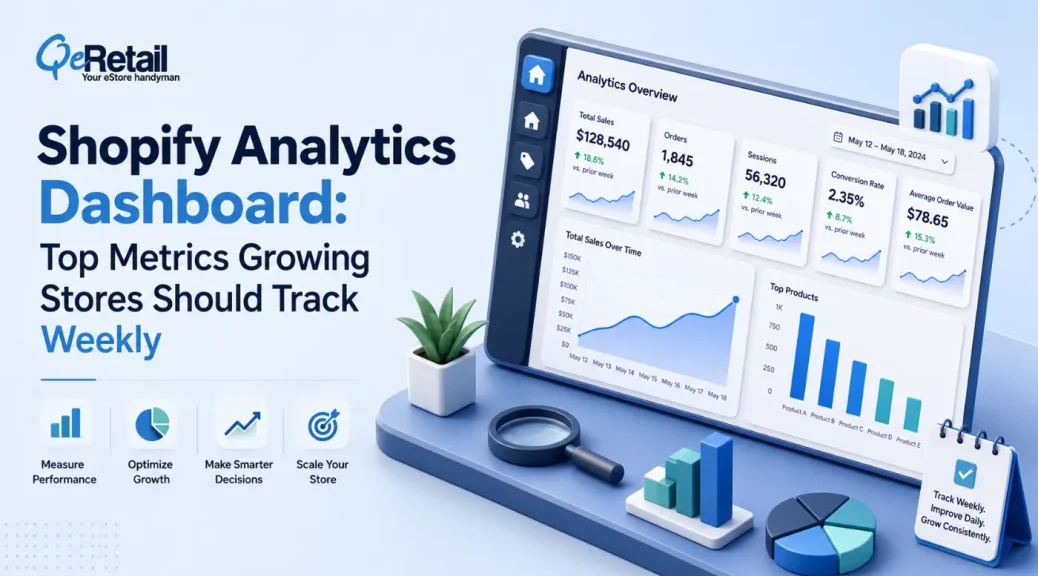
Shopify’s 2026 Global Commerce Report puts average retail customer acquisition cost at $318, up from $274 the year before. Most $100K-$500K stores don’t know whether their number has moved because they check total sales once a week and call it “checking analytics.”
Total sales is a lagging output. It tells you what already happened, not what’s about to happen to your margin two weeks from now.
The gap between stores compounding growth and stores guessing at it isn’t traffic or ad spend. It’s which numbers get watched every Monday. Here’s the dashboard and the sourced benchmarks behind it.
Key Points:
- Pull conversion rate by checkout method, not just by device
- Compare blended CAC against paid-channel CAC before trusting either number alone
- Check whether accelerated checkout is live before blaming the funnel for a flat conversion rate
- Report AOV by mode, not mean, so a handful of large orders don’t hide the typical one
- Segment repeat purchase rate by acquisition channel before reporting a store-wide average
- Flag any week where CAC crosses your trailing 90-day average

What is a Shopify Analytics Dashboard?
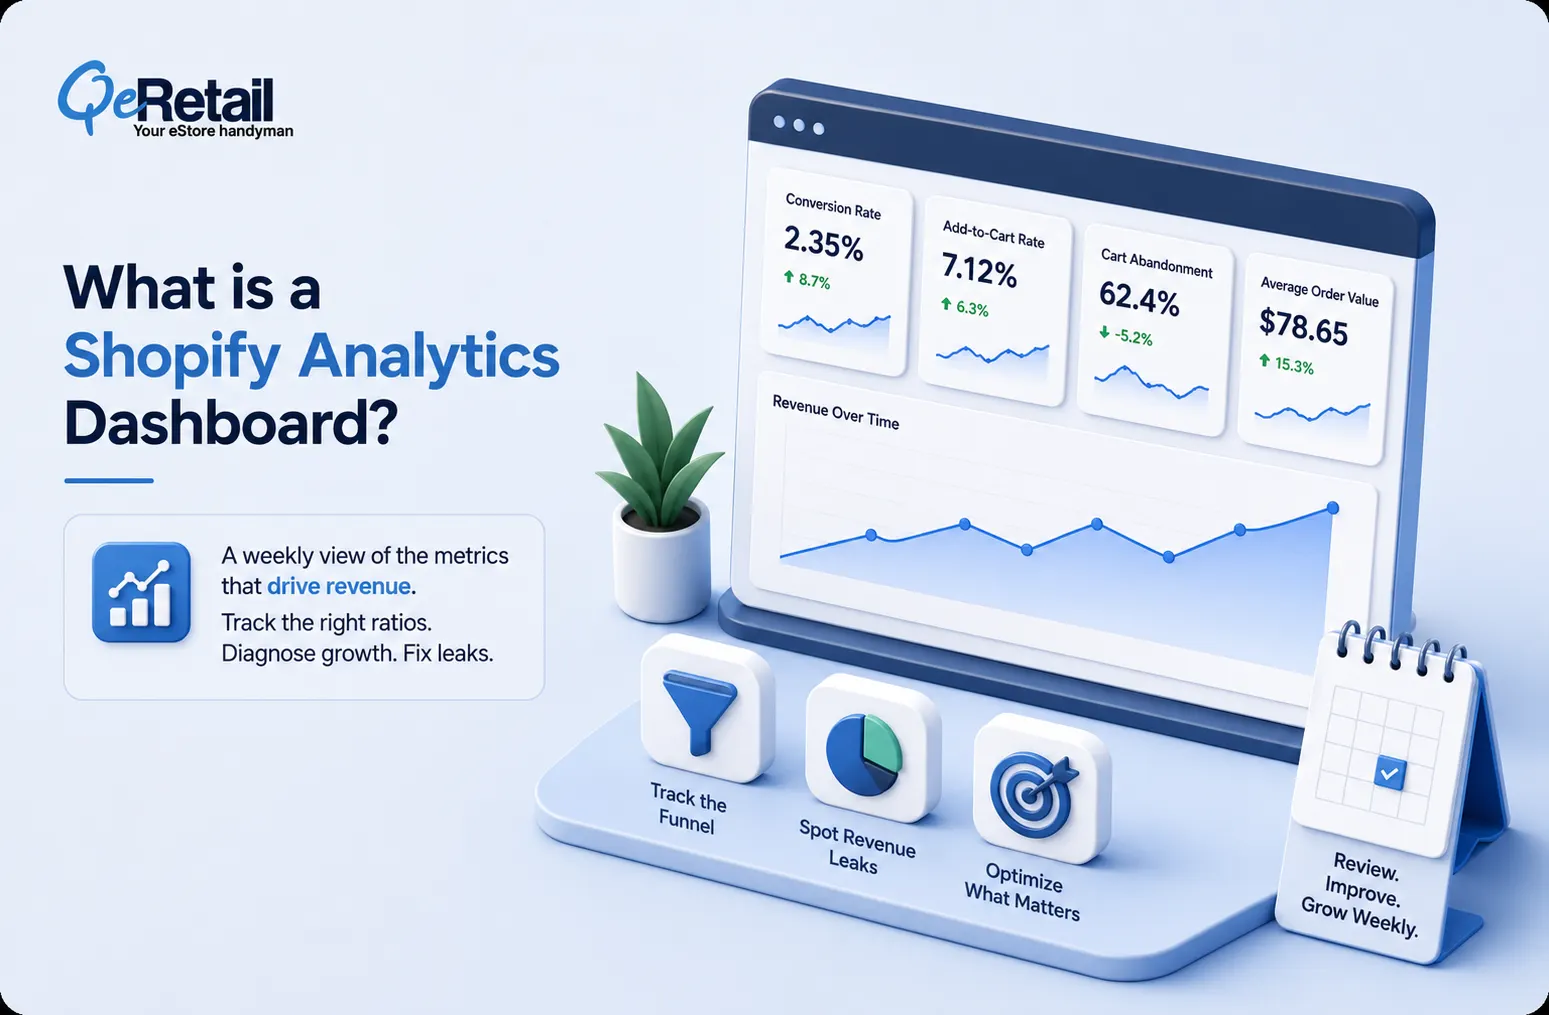
A Shopify analytics dashboard is the weekly view of the metrics that drive revenue, not the number of revenue produced last week. Shopify’s native analytics shows sales, sessions, and orders by default. It doesn’t rank the ratios between them for you, and those ratios are where the real diagnosis lives. Sales rising while conversion rate falls isn’t growth. It’s ad spend covering for a leaky funnel.
The Funnel Metrics That Show Where Revenue Leaks
Your funnel has four checkpoints, and most stores only ever look at one of them.
#1. Conversion rate: The lever most stores ignore is checkout friction, not traffic quality. Shop Pay’s accelerated checkout lifts conversion by up to 50% compared to guest checkout and outpaces other accelerated checkouts by at least 10%.
#2. Add-to-cart rate: The step before conversion. A falling rate here points to product page problems, not checkout problems, and fixing checkout won’t move it.
#3. Cart abandonment rate: Still the widest gap between traffic and revenue in most funnels. Track it by device and payment step, since the leak is trust, cost, or friction, never all three equally.
#4. Average order value: Averages mislead. On Shopify’s own demo store Kinda Hot Sauce, the mean order value is $24, but the modal (most common) order is only $15. A few large orders pulled the average up while masking what most customers actually spend.
Expert Take:
A rising conversion rate paired with a flat modal order value usually means checkout got easier, not that merchandising got better. Check which one moved before crediting the funnel.
Quick Wins:
- Turn on accelerated checkout before running more traffic to the same checkout flow
- Track abandonment by payment step, not as one blended percentage
- Build your free-shipping threshold around your modal order value, not your mean
The Acquisition Metrics That Show What Growth Costs
Growth that costs more than it returns isn’t growth. It’s spend with a delay.
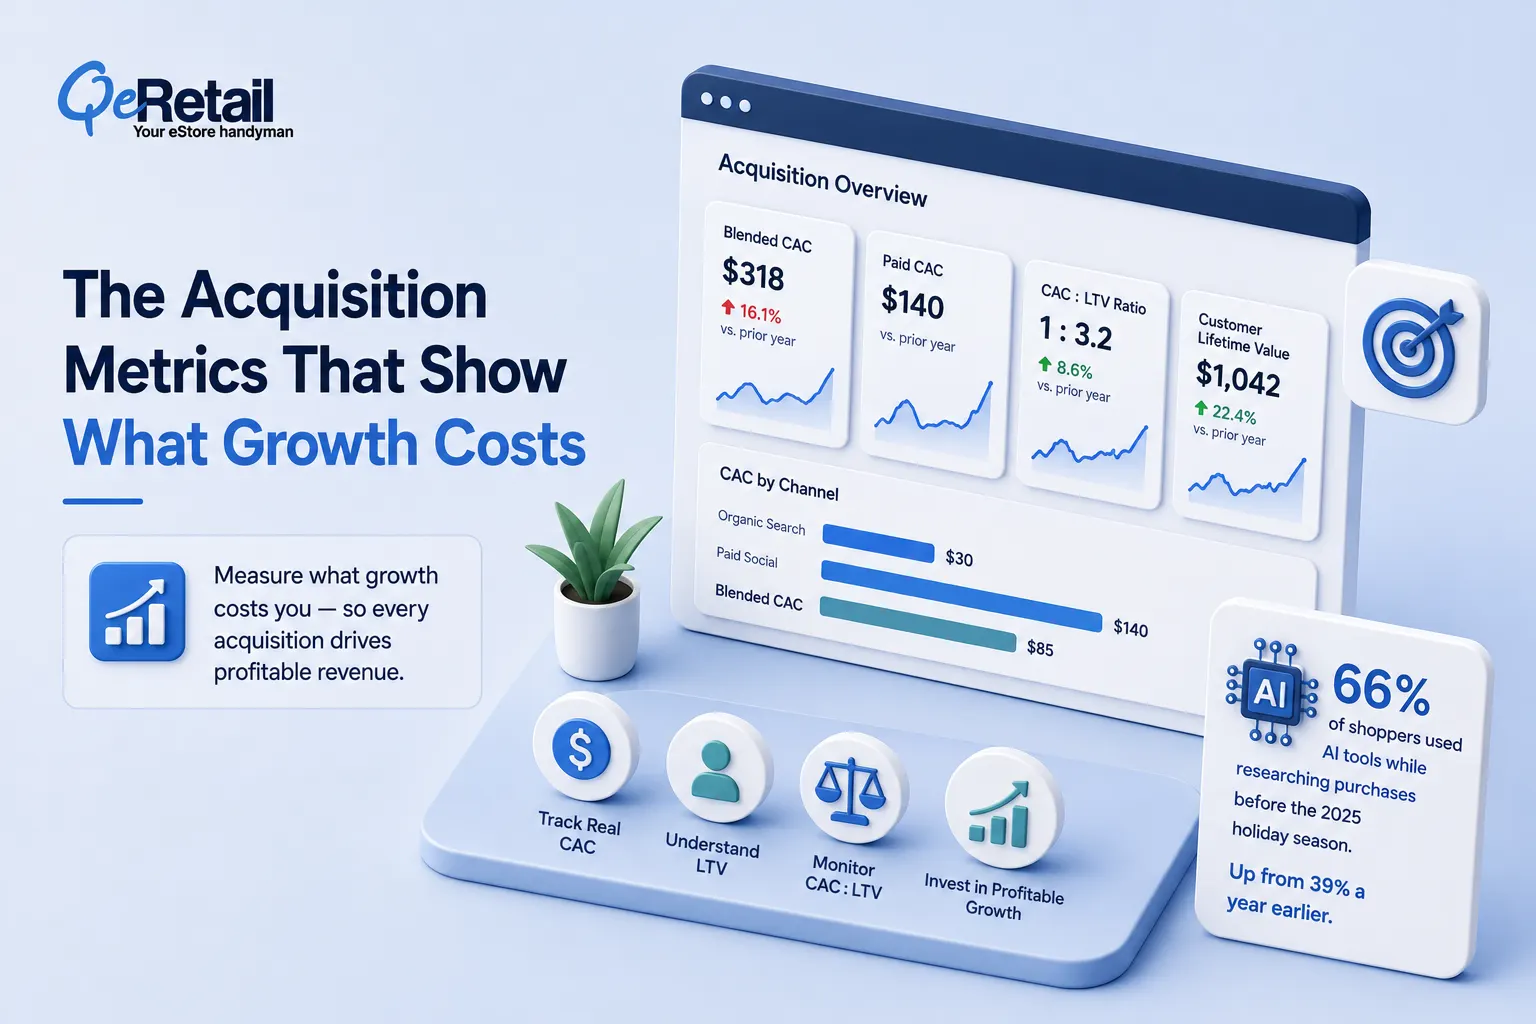
#1. Blended CAC: Shopify’s 2026 Global Commerce Report shows blended retail CAC at $318, up from $274 the year prior. That one number hides which channel is actually funding it.
#2. Paid CAC: A blended figure can look healthy while individual channels don’t. Shopify’s own modeling shows a campaign at $30 CAC from organic search and one at $140 CAC from paid social blending to a comfortable-looking $85 average.
#3. CAC: LTV ratio: The number that tells you whether a cheap customer is actually cheap. A low CAC on a customer who never returns is still a loss once support and fulfillment costs land.
#4. Customer lifetime value: The denominator that makes CAC meaningful. Shopify’s own case data shows why channel choice matters here: stores running Shop Campaigns saw new-customer growth reach 22% to 43% of total daily growth, with meaningfully faster repeat-purchase timing than other channels.
Expert Take:
Blended CAC is not a health metric. It’s an average of your best channel and your worst one, and the worst one usually stays funded because nobody split the number.
Consumer behavior is shifting the acquisition math too. 66% of shoppers used generative AI tools while researching purchases before the 2025 holiday season, up from 39% a year earlier.
The Retention Metrics That Show If Growth Compounds
Acquisition gets the budget. Retention gets the compounding return, and most $100K-$400K stores still track it least.
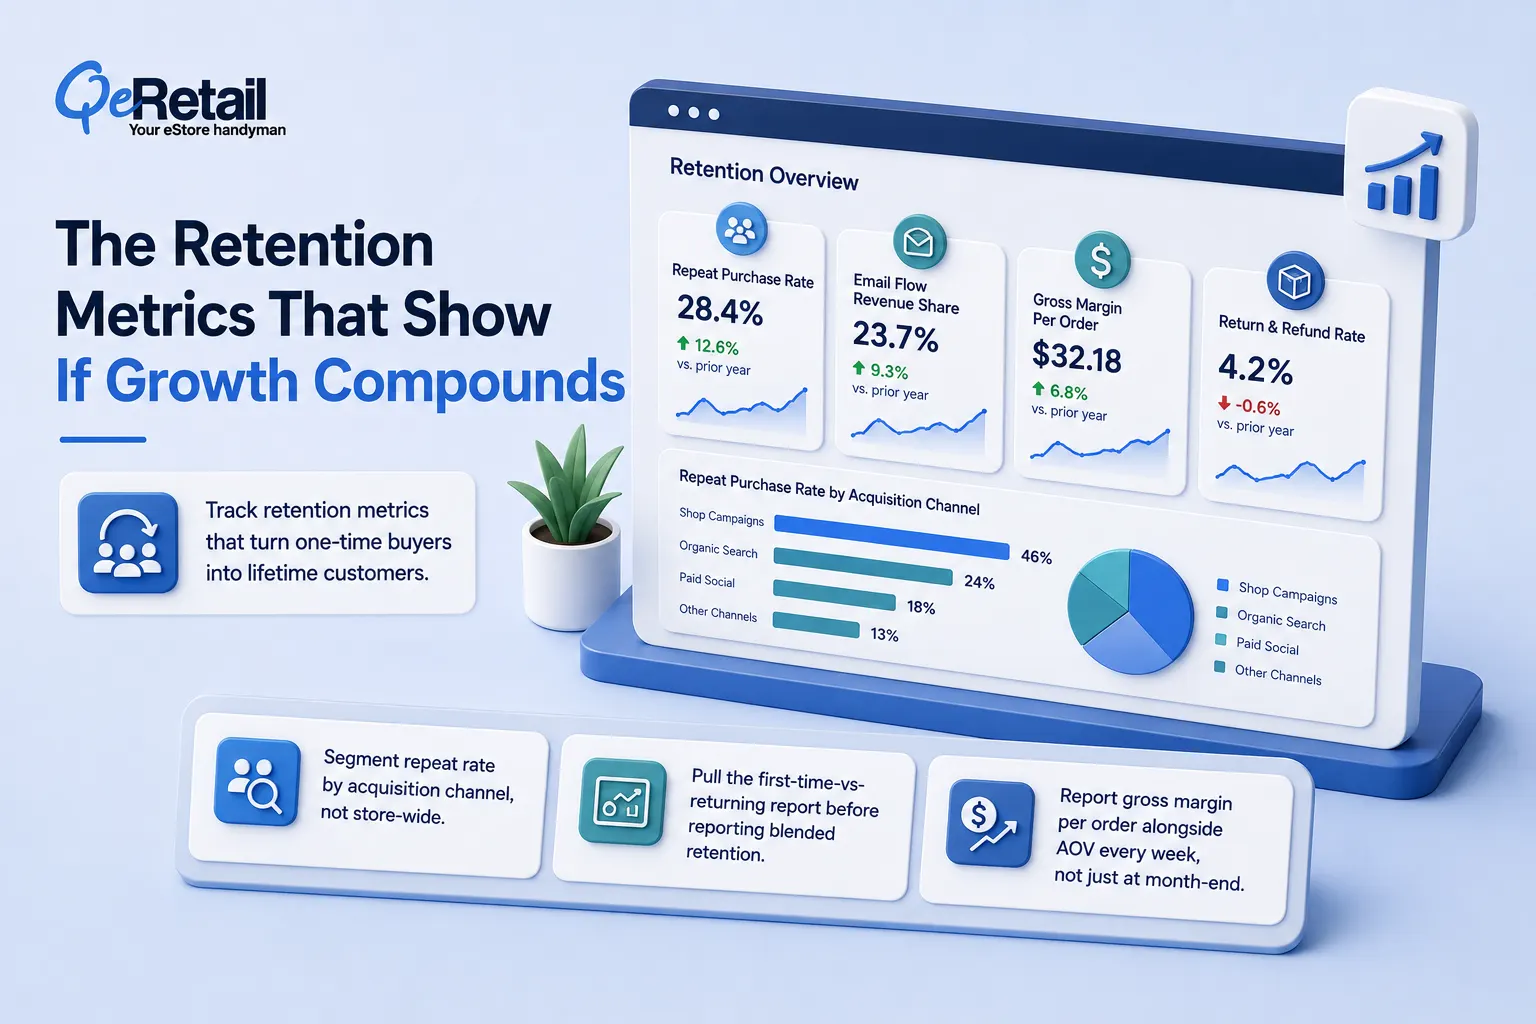
#1. Repeat Purchase Rate: Segment it by acquisition channel before reporting one number. Shopify’s own case data found customers acquired through Shop Campaigns repurchased within 14 days at roughly double the rate of those acquired elsewhere.
#2. Email Flow Revenue Share: Shopify Analytics ships with 60+ prebuilt reports built to separate flow-driven revenue from campaign-driven revenue, including repeat purchase behavior by acquisition period.
#3. Gross Margin Per Order: The number CAC and AOV both feed into. A rising AOV with a shrinking margin per order means you’re selling more to make less.
#4. Return and Refund Rate: Rarely on the weekly dashboard, always on the P&L. A category creeping upward usually traces back to a sizing chart or product description problem, not a shipping carrier.
Expert Take:
A repeat-purchase number that isn’t segmented by channel tells you nothing about which acquisition spend is actually working twice.
Quick Wins:
- Segment repeat rate by acquisition channel, not store-wide
- Pull the first-time-vs-returning report before reporting blended retention
- Report gross margin per order alongside AOV every week, not just at month-end

Final Thoughts
Most stores that check Shopify analytics once a week aren’t tracking metrics. They’re tracking one number and calling it a system.
The stores compounding growth run this dashboard every Monday: funnel first, acquisition cost second, retention and margin third. Each layer catches what the one before it can’t see.
You don’t need twelve dashboards. You need a partner who builds this into one weekly view and tells you which number moved and why. Need a partner who builds one weekly view, tells which number move, why. Book free consult with QeRetail map store numbers against twelve benchmark, one session.
Frequently Asked Questions
What Is A Good Shopify Conversion Rate In 2026?
How Often Should I Check My Shopify Analytics Dashboard?
What Is Shopify's Average Customer Acquisition Cost Right Now?
Can A Small Team Track All 12 Metrics Without Extra Software?
Table of Contents